Hamzeh Ghasemzadeh
Classifying Phonotrauma Severity from Vocal Fold Images with Soft Ordinal Regression
Nov 12, 2025


Abstract:Phonotrauma refers to vocal fold tissue damage resulting from exposure to forces during voicing. It occurs on a continuum from mild to severe, and treatment options can vary based on severity. Assessment of severity involves a clinician's expert judgment, which is costly and can vary widely in reliability. In this work, we present the first method for automatically classifying phonotrauma severity from vocal fold images. To account for the ordinal nature of the labels, we adopt a widely used ordinal regression framework. To account for label uncertainty, we propose a novel modification to ordinal regression loss functions that enables them to operate on soft labels reflecting annotator rating distributions. Our proposed soft ordinal regression method achieves predictive performance approaching that of clinical experts, while producing well-calibrated uncertainty estimates. By providing an automated tool for phonotrauma severity assessment, our work can enable large-scale studies of phonotrauma, ultimately leading to improved clinical understanding and patient care.
Experimental Framework for Generating Reliable Ground Truth for Laryngeal Spatial Segmentation Tasks
Sep 04, 2024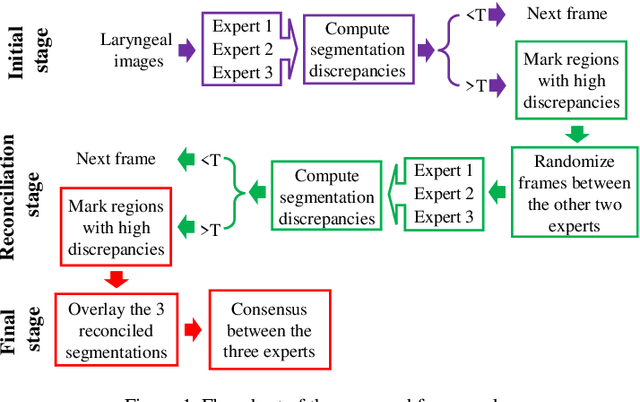
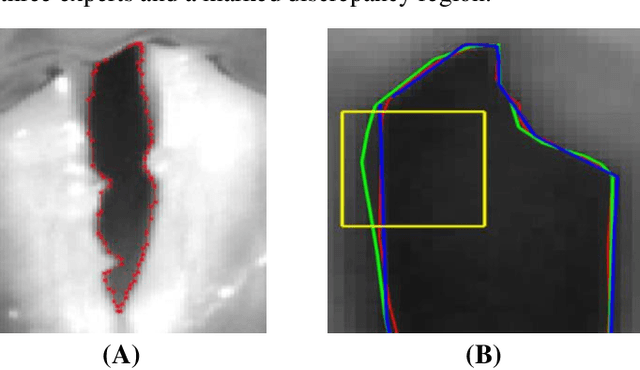
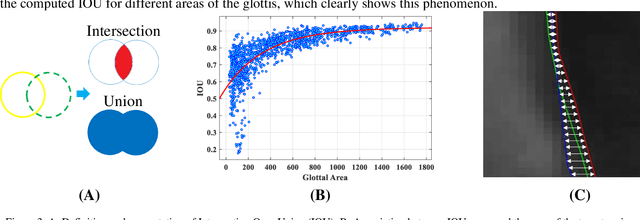
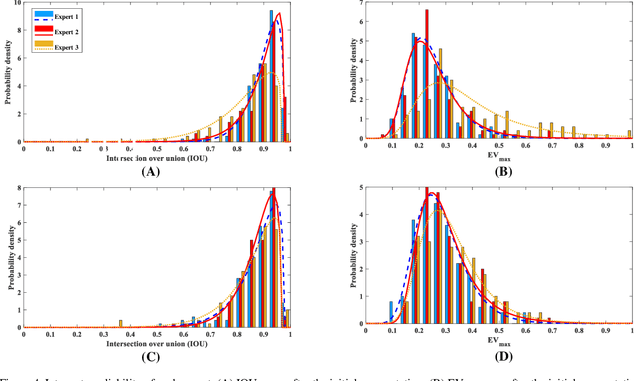
Abstract:Objective: The validity of objective measures derived from high-speed videoendoscopy (HSV) depends, among other factors, on the validity of spatial segmentation. Evaluation of the validity of spatial segmentation requires the existence of reliable ground truths. This study presents a framework for creating reliable ground truth with sub-pixel resolution and then evaluates its performance. Method: The proposed framework is a three-stage process. First, three laryngeal imaging experts performed the spatial segmentation task. Second, regions with high discrepancies between experts were determined and then overlaid onto the segmentation outcomes of each expert. The marked HSV frames from each expert were randomly assigned to the two remaining experts, and they were tasked to make proper adjustments and modifications to the initial segmentation within disparity regions. Third, the outcomes of this reconciliation phase were analyzed again and regions with continued high discrepancies were identified and adjusted based on the consensus among the three experts. This three-stage framework was tested using a custom graphical user interface that allowed precise piece-wise linear segmentation of the vocal fold edges. Inter-rate reliability of segmentation was evaluated using 12 HSV recordings. 10% of the frames from each HSV file were randomly selected to assess the intra-rater reliability. Result and conclusion: The reliability of spatial segmentation progressively improved as it went through the three stages of the framework. The proposed framework generated highly reliable and valid ground truths for evaluating the validity of automated spatial segmentation methods.
Effects of Recording Condition and Number of Monitored Days on Discriminative Power of the Daily Phonotrauma Index
Sep 04, 2024


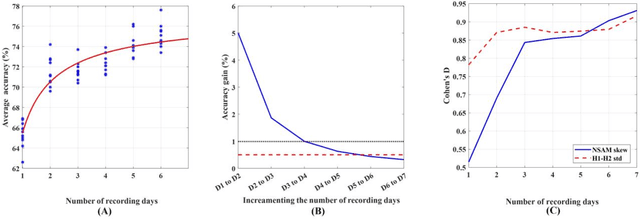
Abstract:Objective: The Daily Phonotrauma Index (DPI) can quantify pathophysiological mechanisms associated with daily voice use in individuals with phonotraumatic vocal hyperfunction (PVH). Since DPI was developed based on week-long ambulatory voice monitoring, this study investigated if DPI can achieve comparable performance using (1) short laboratory speech tasks and (2) fewer than seven days of ambulatory data. Method: An ambulatory voice monitoring system recorded the vocal function/behavior of 134 females with PVH and vocally healthy matched controls in two different conditions. In the lab, the participants read the first paragraph of the Rainbow Passage and produced spontaneous speech (in-lab data). They were then monitored for seven days (in-field data). Separate DPI models were trained from in-lab and in-field data using the standard deviation of the difference between the magnitude of the first two harmonics (H1-H2) and the skewness of neck-surface acceleration magnitude. First, 10-fold cross-validation evaluated classification performance of in-lab and in-field DPIs. Second, the effect of the number of ambulatory monitoring days on the accuracy of in-field DPI classification was quantified. Results: The average in-lab DPI accuracy computed from the Rainbow passage and spontaneous speech were, respectively, 57.9% and 48.9%, which are close to chance performance. The average classification accuracy of in-field DPI was significantly higher with a very large effect size (73.4%, Cohens D = 1.8). Second, the average in-field DPI accuracy increased from 66.5% for one day to 75.0% for seven days, with the gain of including an additional day on accuracy dropping below 1 percentage point after 4 days.
Toward Generalizable Machine Learning Models in Speech, Language, and Hearing Sciences: Sample Size Estimation and Reducing Overfitting
Aug 30, 2023Abstract:This study's first purpose is to provide quantitative evidence that would incentivize researchers to instead use the more robust method of nested cross-validation. The second purpose is to present methods and MATLAB codes for doing power analysis for ML-based analysis during the design of a study. Monte Carlo simulations were used to quantify the interactions between the employed cross-validation method, the discriminative power of features, the dimensionality of the feature space, and the dimensionality of the model. Four different cross-validations (single holdout, 10-fold, train-validation-test, and nested 10-fold) were compared based on the statistical power and statistical confidence of the ML models. Distributions of the null and alternative hypotheses were used to determine the minimum required sample size for obtaining a statistically significant outcome ({\alpha}=0.05, 1-\b{eta}=0.8). Statistical confidence of the model was defined as the probability of correct features being selected and hence being included in the final model. Our analysis showed that the model generated based on the single holdout method had very low statistical power and statistical confidence and that it significantly overestimated the accuracy. Conversely, the nested 10-fold cross-validation resulted in the highest statistical confidence and the highest statistical power, while providing an unbiased estimate of the accuracy. The required sample size with a single holdout could be 50% higher than what would be needed if nested cross-validation were used. Confidence in the model based on nested cross-validation was as much as four times higher than the confidence in the single holdout-based model. A computational model, MATLAB codes, and lookup tables are provided to assist researchers with estimating the sample size during the design of their future studies.
 Add to Chrome
 Add to Firefox
 Add to Edge