Farshad Barahimi
Massive Enhanced Extracted Email Features Tailored for Cosine Distance
May 11, 2022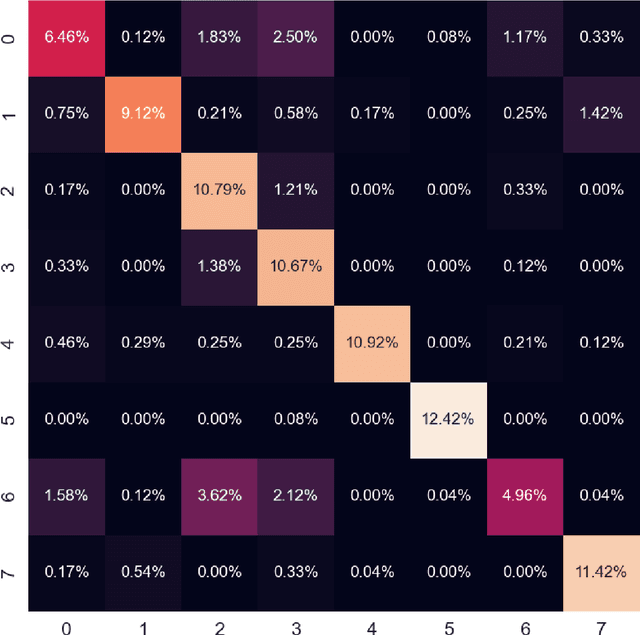
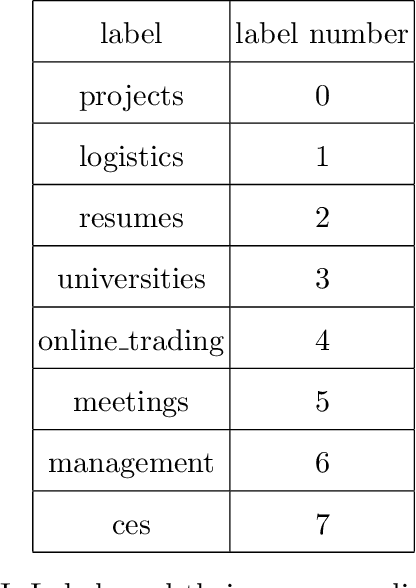
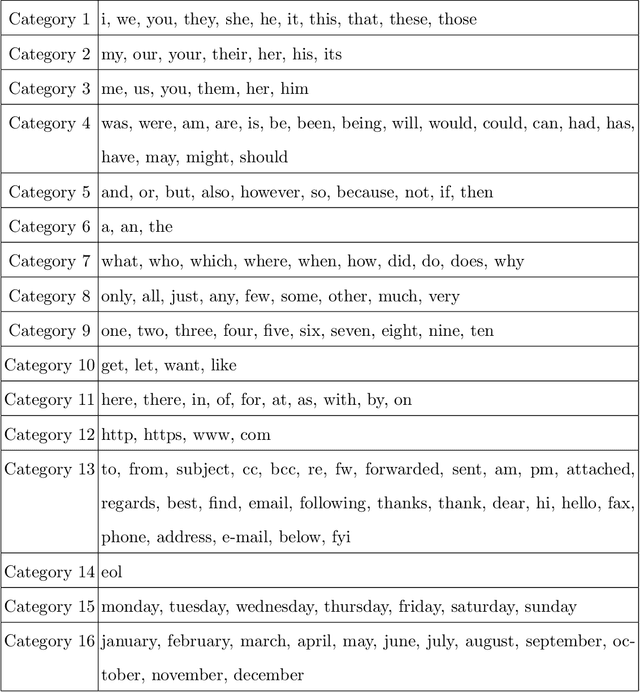
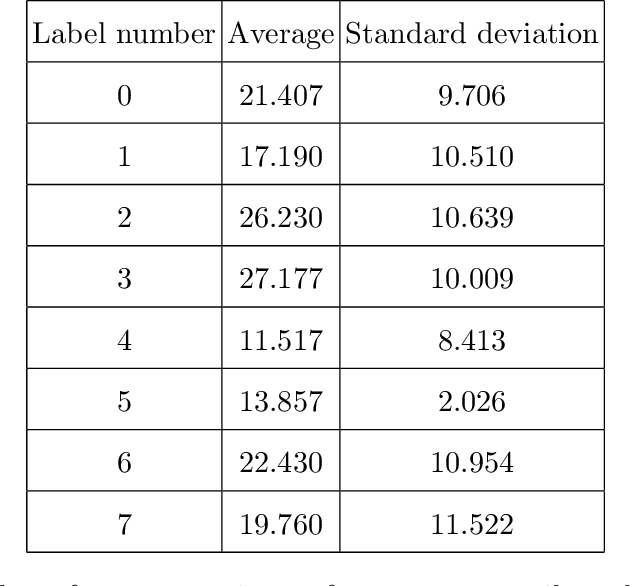
Abstract:In this paper, the process of converting the Enron email dataset (the version cited in the preprint) to thousands of features per email for a selected set of 2400 labelled emails is explained and evaluated. The final features are tailored for Cosine distance so that the Cosine distance invertly reflect the number of top indicative words of each email that are common between the two emails in an explainable normalized fashion. The labelling is based on the leaf folder name in the Enron email dataset (the version cited in the preprint) folders tree and the 2400 emails selected consist 300 emails for each of the 8 labels. The evaluation is based on the accuracy of a k nearest neighbours majority voting classification using Cosine distance. In addition to KNN majority voting classification accuracy and confusion matrix, some statistics for the process is reported. The KNN majority voting classification accuracy using Cosine distance is 76.75% which shows at least some level of success given the 8 labels involved. The result of conversion is 48557 features per selected email out of which exactly 40 features per email are non-zero. The result of conversion is a data set named MeeefTCD (Massive Enhanced Extracted Email Features Tailored for Cosine Distance) available at https://web.cs.dal.ca/~barahimi/data-sets/meeeftcd/ and on a github repository mentioned in this paper.
Multi-point dimensionality reduction to improve projection layout reliability
Jan 15, 2021
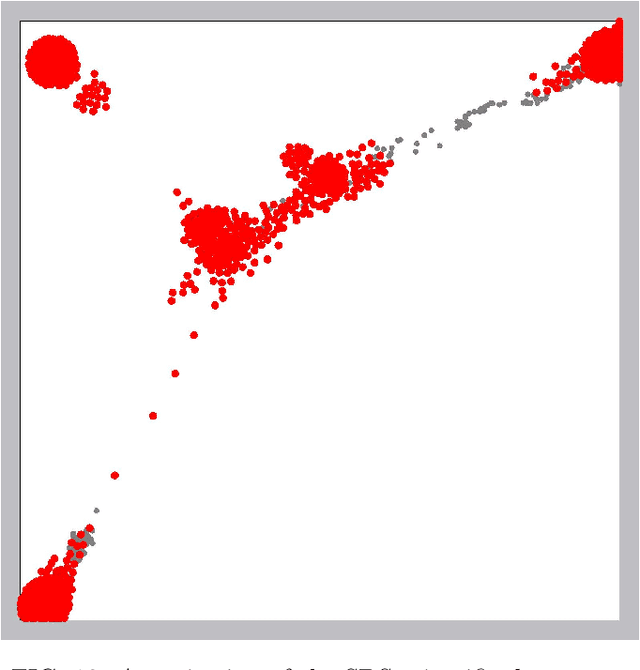
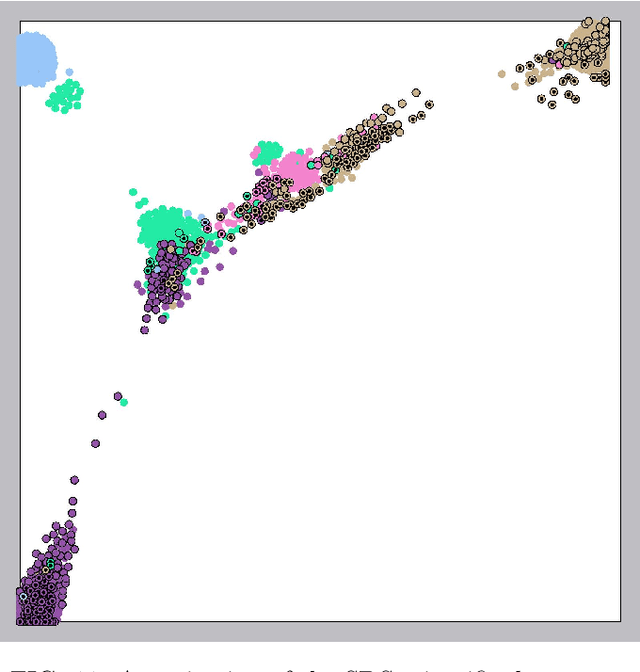
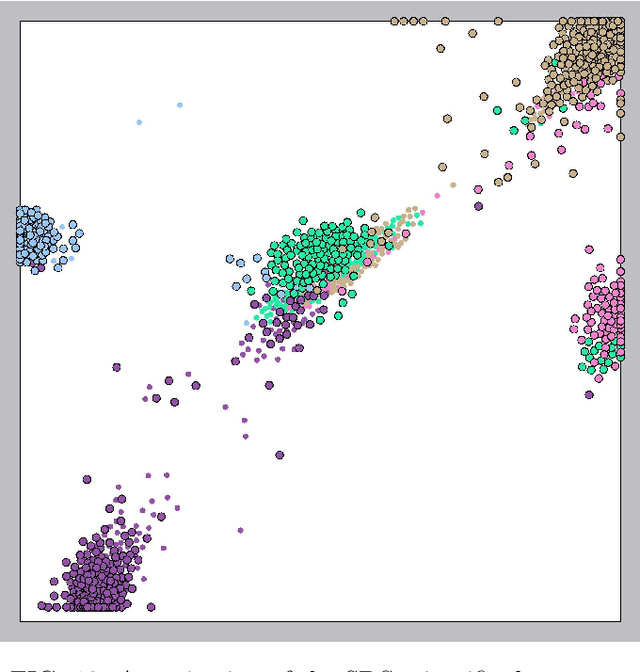
Abstract:In ordinary Dimensionality Reduction (DR), each data instance in an m-dimensional space (original space) is mapped to one point in a d-dimensional space (visual space), preserving as much as possible distance and/or neighborhood relationships. Despite their popularity, even for simple datasets, the existing DR techniques unavoidably may produce misleading visual representations. The problem is not with the existing solutions but with problem formulation. For two dimensional visual space, if data instances are not co-planar or do not lie on a 2D manifold, there is no solution for the problem, and the possible approximations usually result in layouts with inaccuracies in the distance preservation and overlapped neighborhoods. In this paper, we elaborate on the concept of Multi-point Dimensionality Reduction where each data instance can be mapped to possibly more than one point in the visual space by providing the first general solution to it as a step toward mitigating this issue. By duplicating points, background information is added to the visual representation making local neighborhoods in the visual space more faithful to the original space. Our solution, named Red Gray Plus, is built upon and extends a combination of ordinary DR and graph drawing techniques. We show that not only Multi-point Dimensionality Reduction can be one of the potential directions to improve DR layouts' reliability but also that our initial solution to the problem outperforms popular ordinary DR methods quantitatively.
 Add to Chrome
 Add to Firefox
 Add to Edge