Diego Rojo
Petal-X: Human-Centered Visual Explanations to Improve Cardiovascular Risk Communication
Jun 26, 2024Abstract:Cardiovascular diseases (CVDs), the leading cause of death worldwide, can be prevented in most cases through behavioral interventions. Therefore, effective communication of CVD risk and projected risk reduction by risk factor modification plays a crucial role in reducing CVD risk at the individual level. However, despite interest in refining risk estimation with improved prediction models such as SCORE2, the guidelines for presenting these risk estimations in clinical practice remained essentially unchanged in the last few years, with graphical score charts (GSCs) continuing to be one of the prevalent systems. This work describes the design and implementation of Petal-X, a novel tool to support clinician-patient shared decision-making by explaining the CVD risk contributions of different factors and facilitating what-if analysis. Petal-X relies on a novel visualization, Petal Product Plots, and a tailor-made global surrogate model of SCORE2, whose fidelity is comparable to that of the GSCs used in clinical practice. We evaluated Petal-X compared to GSCs in a controlled experiment with 88 healthcare students, all but one with experience with chronic patients. The results show that Petal-X outperforms GSC in critical tasks, such as comparing the contribution to the patient's 10-year CVD risk of each modifiable risk factor, without a significant loss of perceived transparency, trust, or intent to use. Our study provides an innovative approach to the visualization and explanation of risk in clinical practice that, due to its model-agnostic nature, could continue to support next-generation artificial intelligence risk assessment models.
AHMoSe: A Knowledge-Based Visual Support System for Selecting Regression Machine Learning Models
Jan 28, 2021


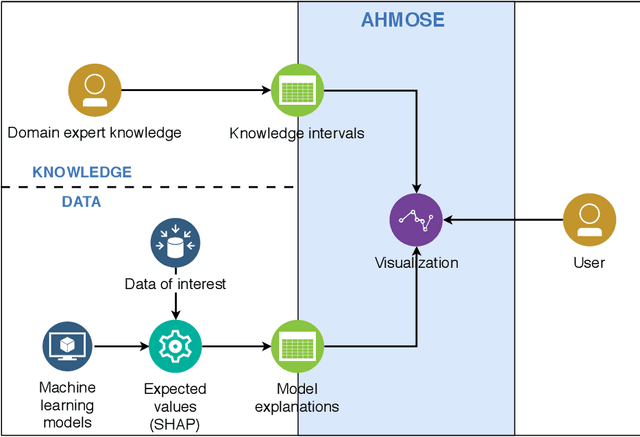
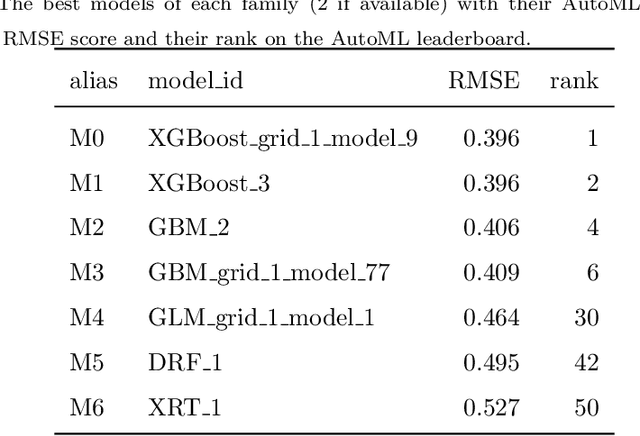
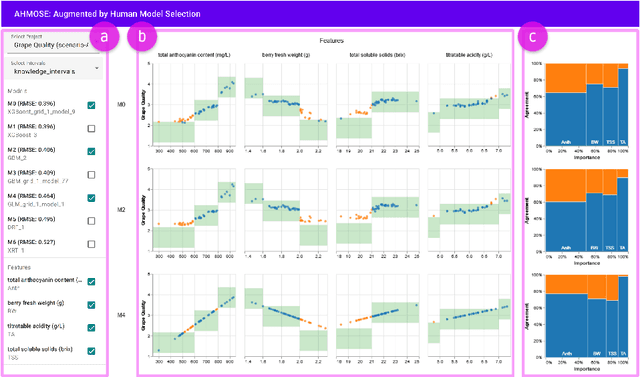
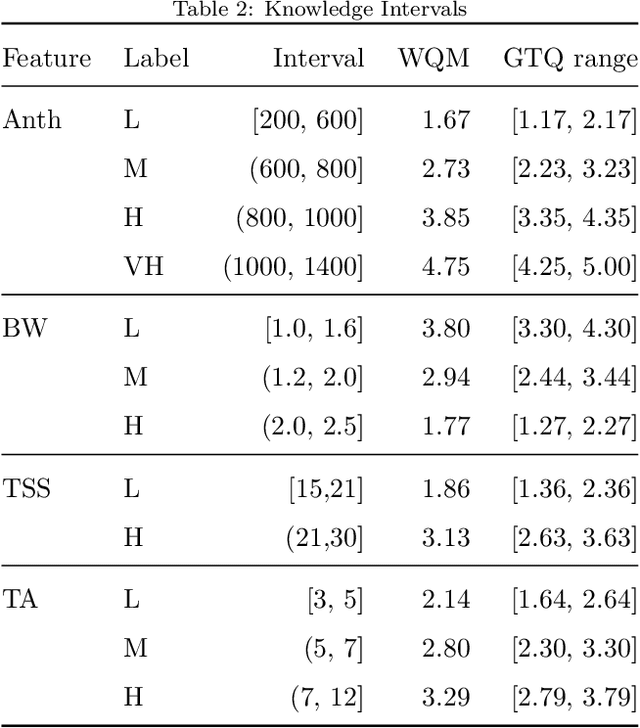
Abstract:Decision support systems have become increasingly popular in the domain of agriculture. With the development of Automated Machine Learning, agricultural experts are now able to train, evaluate and make predictions using cutting edge machine learning (ML) models without the need for much ML knowledge. Although this automated approach has led to successful results in many scenarios, in certain cases (e.g., when few labeled datasets are available) choosing among different models with similar performance metrics is a difficult task. Furthermore, these systems do not commonly allow users to incorporate their domain knowledge that could facilitate the task of model selection, and to gain insight into the prediction system for eventual decision making. To address these issues, in this paper we present AHMoSe, a visual support system that allows domain experts to better understand, diagnose and compare different regression models, primarily by enriching model-agnostic explanations with domain knowledge. To validate AHMoSE, we describe a use case scenario in the viticulture domain, grape quality prediction, where the system enables users to diagnose and select prediction models that perform better. We also discuss feedback concerning the design of the tool from both ML and viticulture experts.
 Add to Chrome
 Add to Firefox
 Add to Edge