Borbala Hunyadi
A Singular-value-based Marker for the Detection of Atrial Fibrillation Using High-resolution Electrograms and Multi-lead ECG
Jul 06, 2023


Abstract:The severity of atrial fibrillation (AF) can be assessed from intra-operative epicardial measurements (high-resolution electrograms), using metrics such as conduction block (CB) and continuous conduction delay and block (cCDCB). These features capture differences in conduction velocity and wavefront propagation. However, they do not clearly differentiate patients with various degrees of AF while they are in sinus rhythm, and complementary features are needed. In this work, we focus on the morphology of the action potentials, and derive features to detect variations in the atrial potential waveforms. Methods: We show that the spatial variation of atrial potential morphology during a single beat may be described by changes in the singular values of the epicardial measurement matrix. The method is non-parametric and requires little preprocessing. A corresponding singular value map points at areas subject to fractionation and block. Further, we developed an experiment where we simultaneously measure electrograms (EGMs) and a multi-lead ECG. Results: The captured data showed that the normalized singular values of the heartbeats during AF are higher than during SR, and that this difference is more pronounced for the (non-invasive) ECG data than for the EGM data, if the electrodes are positioned at favorable locations. Conclusion: Overall, the singular value-based features are a useful indicator to detect and evaluate AF. Significance: The proposed method might be beneficial for identifying electropathological regions in the tissue without estimating the local activation time.
Deconvolution of the Functional Ultrasound Response in the Mouse Visual Pathway Using Block-Term Decomposition
Apr 07, 2022


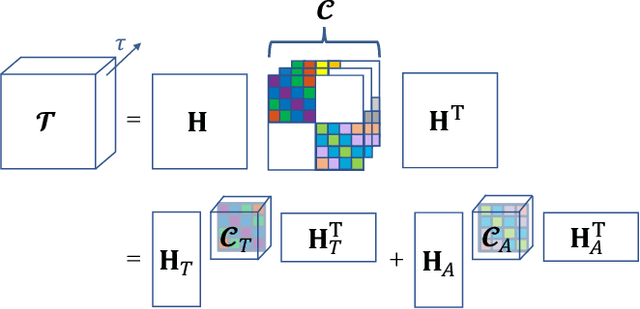
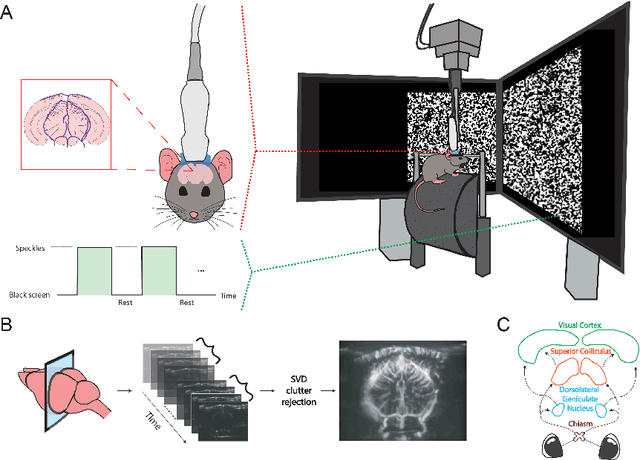
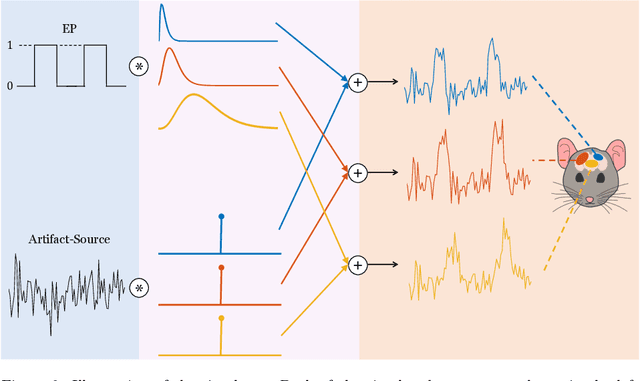
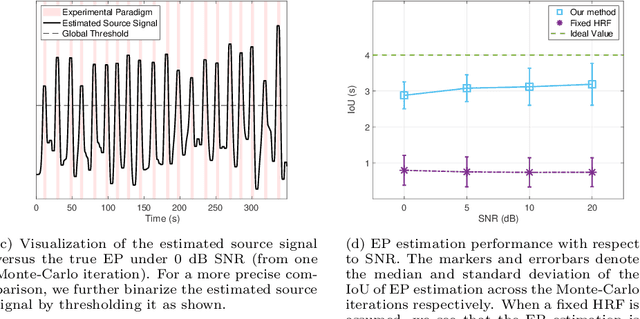
Abstract:Functional ultrasound (fUS) indirectly measures brain activity by recording changes in cerebral blood volume and flow in response to neural activation. Conventional approaches model such functional neuroimaging data as the convolution between an impulse response, known as the hemodynamic response function (HRF), and a binarized representation of the input (i.e., source) signal based on the stimulus onsets, the so-called experimental paradigm (EP). However, the EP may not be enough to characterize the whole complexity of the underlying source signals that evoke the hemodynamic changes, such as in the case of spontaneous resting state activity. Furthermore, the HRF varies across brain areas and stimuli. To achieve an adaptable framework that can capture such dynamics and unknowns of the brain function, we propose a deconvolution method for multivariate fUS time-series that reveals both the region-specific HRFs, and the source signals that induce the hemodynamic responses in the studied regions. We start by modeling the fUS time-series as convolutive mixtures and use a tensor-based approach for deconvolution based on two assumptions: (1) HRFs are parametrizable, and (2) source signals are uncorrelated. We test our approach on fUS data acquired during a visual experiment on a mouse subject, focusing on three regions within the mouse brain's colliculo-cortical, image-forming pathway: the lateral geniculate nucleus, superior colliculus and visual cortex. The estimated HRFs in each region are in agreement with prior works, whereas the estimated source signal is observed to closely follow the EP. Yet, we note a few deviations from the EP in the estimated source signal that most likely arise due to the trial-by-trial variability of the neural response across different repetitions of the stimulus observed in the selected regions.
 Add to Chrome
 Add to Firefox
 Add to Edge