Alexander Rind
Institute of Creative\Media/Technologies, St. Poelten University of Applied Sciences, Austria
Open Your Ears to Take a Look: A State-of-the-Art Report on the Integration of Sonification and Visualization
Feb 26, 2024Abstract:The research communities studying visualization and sonification for data display and analysis share exceptionally similar goals, essentially making data of any kind interpretable to humans. One community does so by using visual representations of data, the other community does so by employing auditory (non-speech) representations of data. While the two communities have a lot in common, they developed mostly in parallel over the course of the last few decades. With this STAR, we discuss a collection of work that bridges the borders of the two communities, hence a collection of work that aims to integrate the two techniques to one form of audiovisual display, which we argue to be "more than the sum of the two." We introduce and motivate a classification system applicable to such audiovisual displays and categorize a corpus of 57 academic publications that appeared between 2011 and 2023 in categories such as reading level, dataset type, or evaluation system, to mention a few. The corpus also enables a meta-analysis of the field, including regularly occurring design patterns such as type of visualization and sonification techniques, or the use of visual and auditory channels, and the analysis of a co-author network of the field which shows individual teams without much interconnection. The body of work covered in this STAR also relates to three adjacent topics: audiovisual monitoring, accessibility, and audiovisual data art. These three topics are discussed individually in addition to the systematically conducted part of this research. The findings of this report may be used by researchers from both fields to understand the potentials and challenges of such integrated designs, while inspiring them for future collaboration with experts from the respective other field.
Trustworthy Visual Analytics in Clinical Gait Analysis: A Case Study for Patients with Cerebral Palsy
Aug 10, 2022


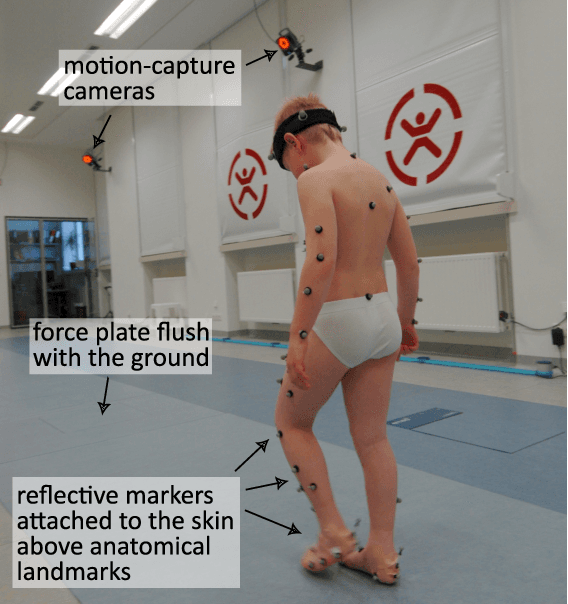
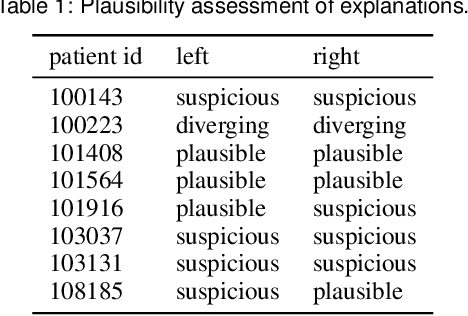
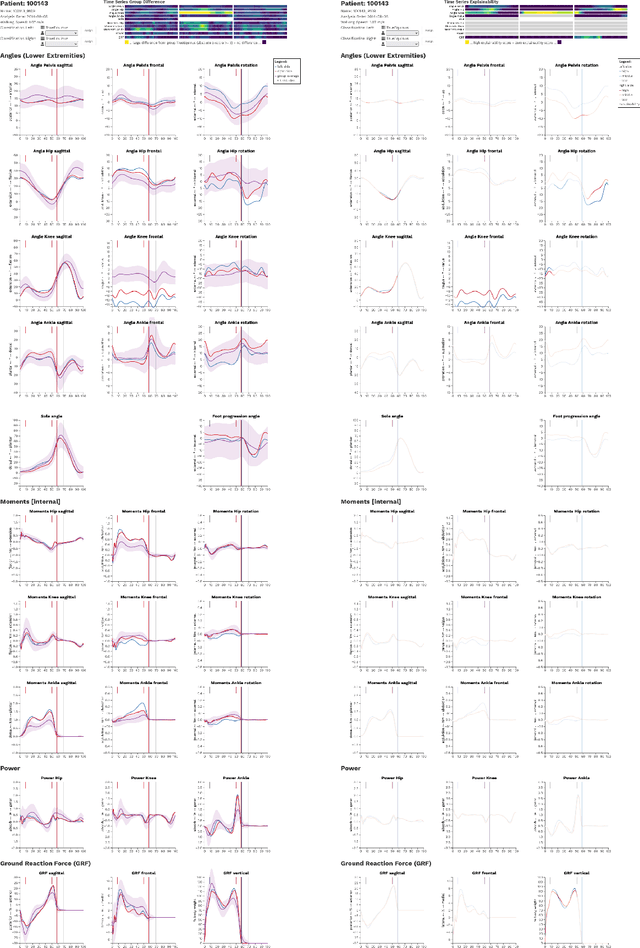
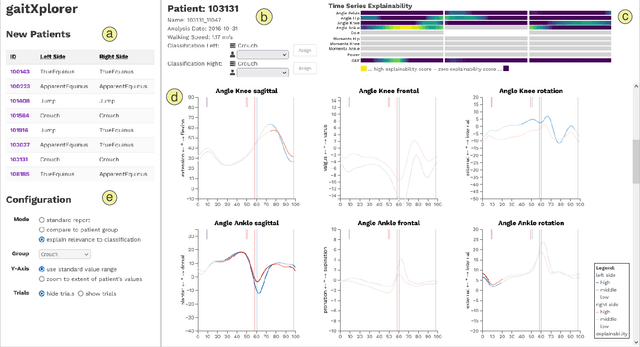
Abstract:Three-dimensional clinical gait analysis is essential for selecting optimal treatment interventions for patients with cerebral palsy (CP), but generates a large amount of time series data. For the automated analysis of these data, machine learning approaches yield promising results. However, due to their black-box nature, such approaches are often mistrusted by clinicians. We propose gaitXplorer, a visual analytics approach for the classification of CP-related gait patterns that integrates Grad-CAM, a well-established explainable artificial intelligence algorithm, for explanations of machine learning classifications. Regions of high relevance for classification are highlighted in the interactive visual interface. The approach is evaluated in a case study with two clinical gait experts. They inspected the explanations for a sample of eight patients using the visual interface and expressed which relevance scores they found trustworthy and which they found suspicious. Overall, the clinicians gave positive feedback on the approach as it allowed them a better understanding of which regions in the data were relevant for the classification.
 Add to Chrome
 Add to Firefox
 Add to Edge