Visually Exploring Multi-Purpose Audio Data
Paper and Code
Oct 09, 2021


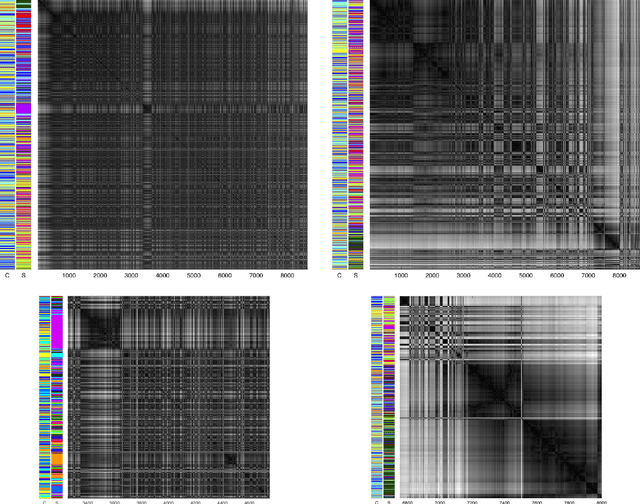
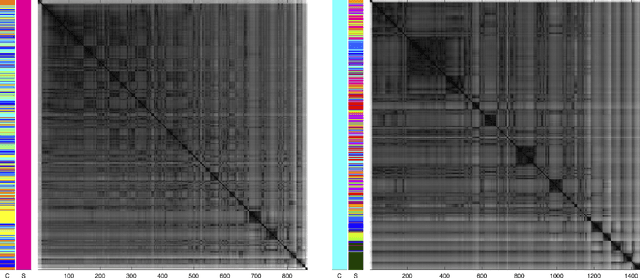
We analyse multi-purpose audio using tools to visualise similarities within the data that may be observed via unsupervised methods. The success of machine learning classifiers is affected by the information contained within system inputs, so we investigate whether latent patterns within the data may explain performance limitations of such classifiers. We use the visual assessment of cluster tendency (VAT) technique on a well known data set to observe how the samples naturally cluster, and we make comparisons to the labels used for audio geotagging and acoustic scene classification. We demonstrate that VAT helps to explain and corroborate confusions observed in prior work to classify this audio, yielding greater insight into the performance - and limitations - of supervised classification systems. While this exploratory analysis is conducted on data for which we know the "ground truth" labels, this method of visualising the natural groupings as dictated by the data leads to important questions about unlabelled data that can help the evaluation and realistic expectations of future (including self-supervised) classification systems.
 Add to Chrome
 Add to Firefox
 Add to Edge