Visualizing the Effects of a Changing Distance on Data Using Continuous Embeddings
Paper and Code
Jul 01, 2016


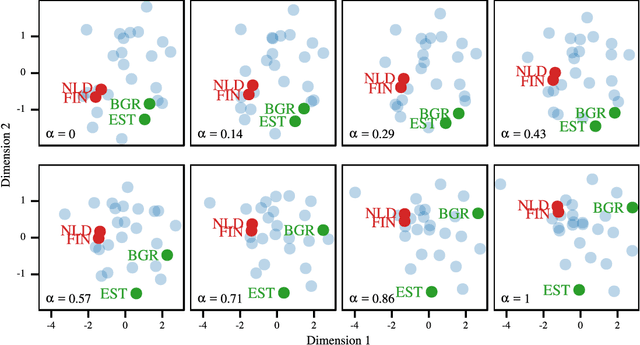
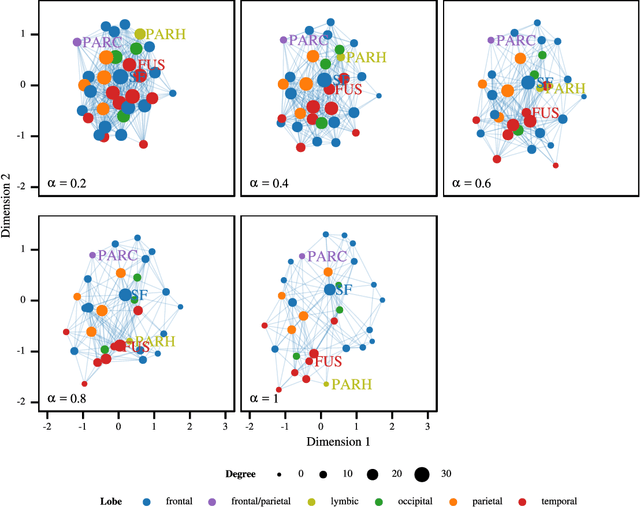
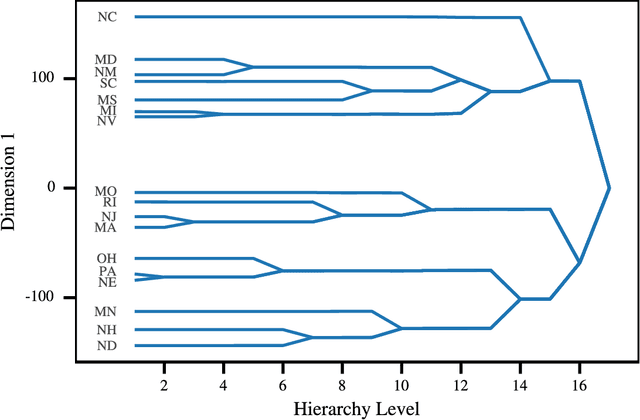
Most Machine Learning (ML) methods, from clustering to classification, rely on a distance function to describe relationships between datapoints. For complex datasets it is hard to avoid making some arbitrary choices when defining a distance function. To compare images, one must choose a spatial scale, for signals, a temporal scale. The right scale is hard to pin down and it is preferable when results do not depend too tightly on the exact value one picked. Topological data analysis seeks to address this issue by focusing on the notion of neighbourhood instead of distance. It is shown that in some cases a simpler solution is available. It can be checked how strongly distance relationships depend on a hyperparameter using dimensionality reduction. A variant of dynamical multi-dimensional scaling (MDS) is formulated, which embeds datapoints as curves. The resulting algorithm is based on the Concave-Convex Procedure (CCCP) and provides a simple and efficient way of visualizing changes and invariances in distance patterns as a hyperparameter is varied. A variant to analyze the dependence on multiple hyperparameters is also presented. A cMDS algorithm that is straightforward to implement, use and extend is provided. To illustrate the possibilities of cMDS, cMDS is applied to several real-world data sets.
 Add to Chrome
 Add to Firefox
 Add to Edge