Visualizing Convolutional Neural Network Protein-Ligand Scoring
Paper and Code
Mar 06, 2018


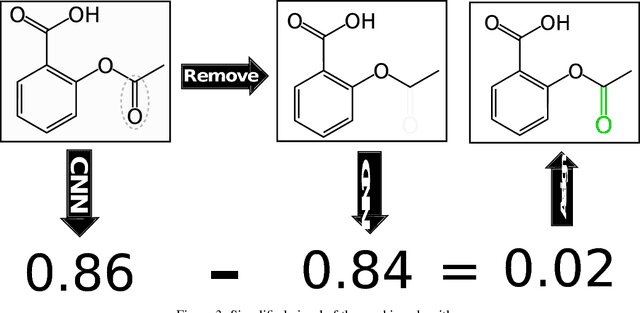
Protein-ligand scoring is an important step in a structure-based drug design pipeline. Selecting a correct binding pose and predicting the binding affinity of a protein-ligand complex enables effective virtual screening. Machine learning techniques can make use of the increasing amounts of structural data that are becoming publicly available. Convolutional neural network (CNN) scoring functions in particular have shown promise in pose selection and affinity prediction for protein-ligand complexes. Neural networks are known for being difficult to interpret. Understanding the decisions of a particular network can help tune parameters and training data to maximize performance. Visualization of neural networks helps decompose complex scoring functions into pictures that are more easily parsed by humans. Here we present three methods for visualizing how individual protein-ligand complexes are interpreted by 3D convolutional neural networks. We also present a visualization of the convolutional filters and their weights. We describe how the intuition provided by these visualizations aids in network design.
 Add to Chrome
 Add to Firefox
 Add to Edge