Techniques for visualizing LSTMs applied to electrocardiograms
Paper and Code
Jun 15, 2018


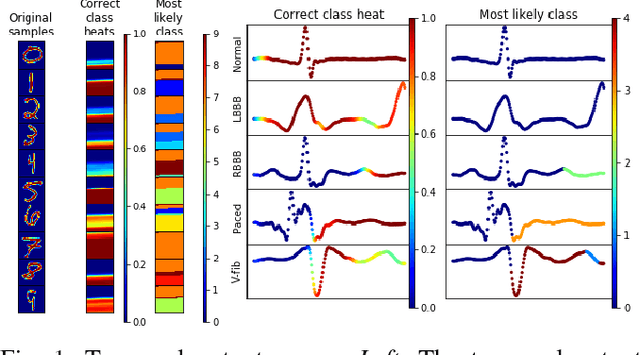
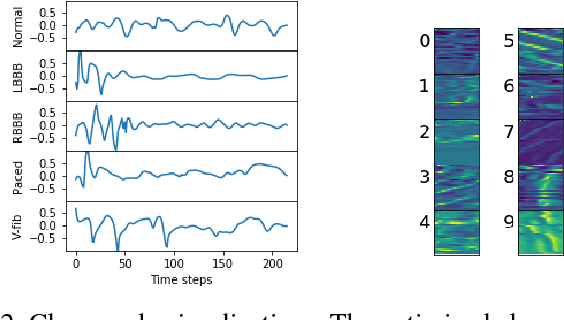
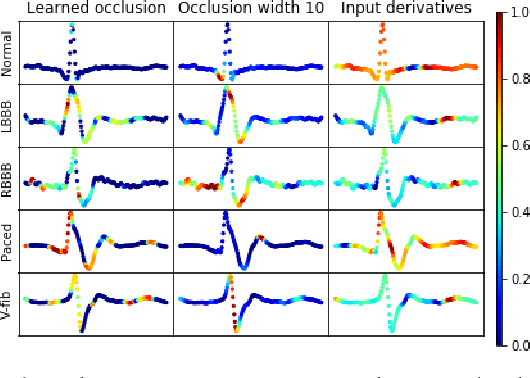
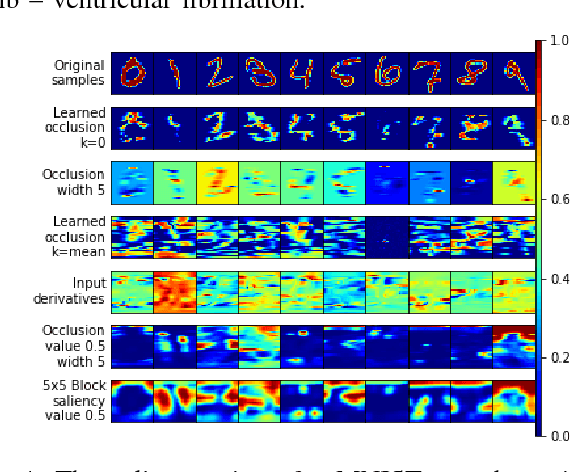
This paper explores four different visualization techniques for long short-term memory (LSTM) networks applied to continuous-valued time series. On the datasets analysed, we find that the best visualization technique is to learn an input deletion mask that optimally reduces the true class score. With a specific focus on single-lead electrocardiograms from the MIT-BIH arrhythmia dataset, we show that salient input features for the LSTM classifier align well with medical theory.
* presented at 2018 ICML Workshop on Human Interpretability in Machine
Learning (WHI 2018), Stockholm, Sweden
 Add to Chrome
 Add to Firefox
 Add to Edge