Synthesize Step-by-Step: Tools, Templates and LLMs as Data Generators for Reasoning-Based Chart VQA
Paper and Code
Mar 28, 2024


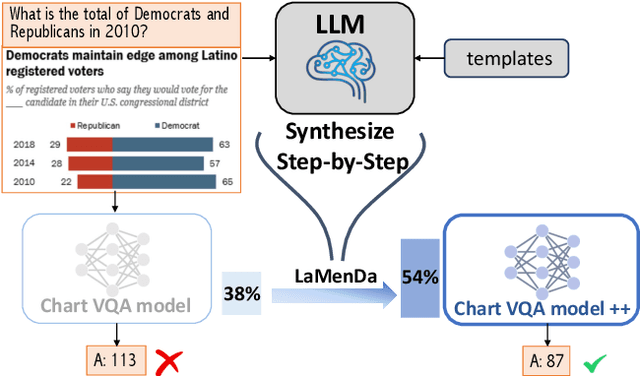
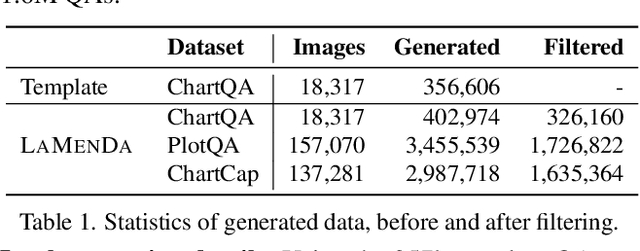
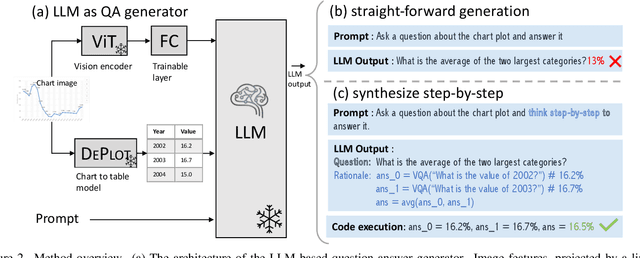
Understanding data visualizations like charts and plots requires reasoning about both visual elements and numerics. Although strong in extractive questions, current chart visual question answering (chart VQA) models suffer on complex reasoning questions. In this work, we address the lack of reasoning ability by data augmentation. We leverage Large Language Models (LLMs), which have shown to have strong reasoning ability, as an automatic data annotator that generates question-answer annotations for chart images. The key innovation in our method lies in the Synthesize Step-by-Step strategy: our LLM-based data generator learns to decompose the complex question into step-by-step sub-questions (rationales), which are then used to derive the final answer using external tools, i.e. Python. This step-wise generation procedure is trained on synthetic data generated using a template-based QA generation pipeline. Experimental results highlight the significance of the proposed step-by-step generation. By training with the LLM-augmented data (LAMENDA), we significantly enhance the chart VQA models, achieving the state-of-the-art accuracy on the ChartQA and PlotQA datasets. In particular, our approach improves the accuracy of the previous state-of-the-art approach from 38% to 54% on the human-written questions in the ChartQA dataset, which needs strong reasoning. We hope our work underscores the potential of synthetic data and encourages further exploration of data augmentation using LLMs for reasoning-heavy tasks.
 Add to Chrome
 Add to Firefox
 Add to Edge