IT-Dendrogram: A New Member of the In-Tree Clustering Family
Paper and Code
Jul 29, 2015


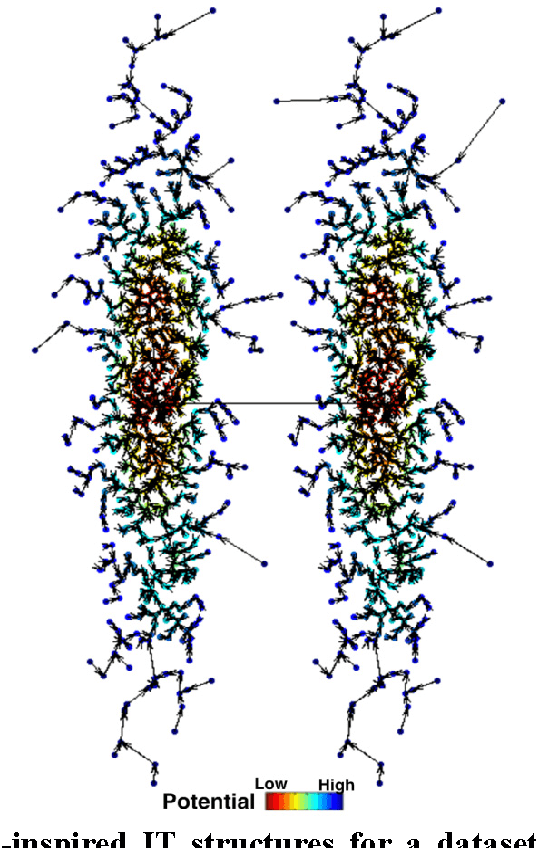
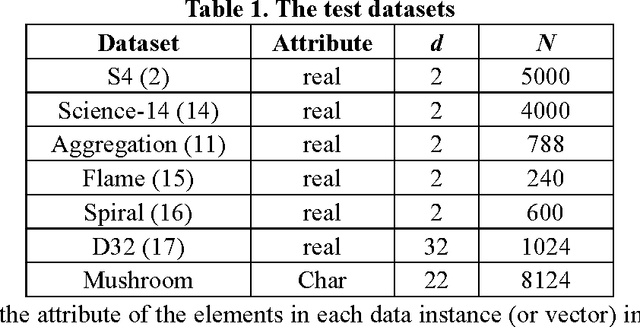
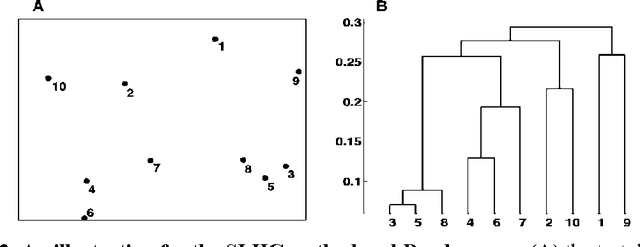
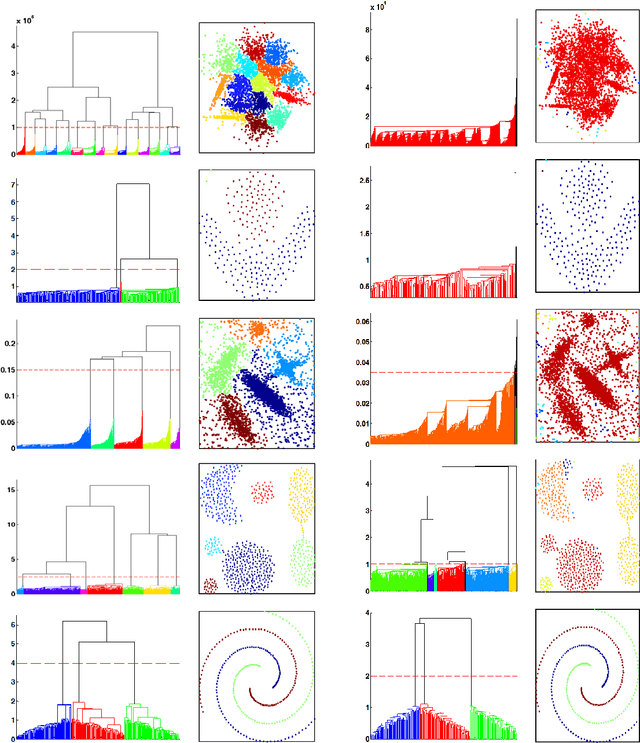
Previously, we proposed a physically-inspired method to construct data points into an effective in-tree (IT) structure, in which the underlying cluster structure in the dataset is well revealed. Although there are some edges in the IT structure requiring to be removed, such undesired edges are generally distinguishable from other edges and thus are easy to be determined. For instance, when the IT structures for the 2-dimensional (2D) datasets are graphically presented, those undesired edges can be easily spotted and interactively determined. However, in practice, there are many datasets that do not lie in the 2D Euclidean space, thus their IT structures cannot be graphically presented. But if we can effectively map those IT structures into a visualized space in which the salient features of those undesired edges are preserved, then the undesired edges in the IT structures can still be visually determined in a visualization environment. Previously, this purpose was reached by our method called IT-map. The outstanding advantage of IT-map is that clusters can still be found even with the so-called crowding problem in the embedding. In this paper, we propose another method, called IT-Dendrogram, to achieve the same goal through an effective combination of the IT structure and the single link hierarchical clustering (SLHC) method. Like IT-map, IT-Dendrogram can also effectively represent the IT structures in a visualization environment, whereas using another form, called the Dendrogram. IT-Dendrogram can serve as another visualization method to determine the undesired edges in the IT structures and thus benefit the IT-based clustering analysis. This was demonstrated on several datasets with different shapes, dimensions, and attributes. Unlike IT-map, IT-Dendrogram can always avoid the crowding problem, which could help users make more reliable cluster analysis in certain problems.
 Add to Chrome
 Add to Firefox
 Add to Edge