Interpreting wealth distribution via poverty map inference using multimodal data
Paper and Code
Feb 17, 2023


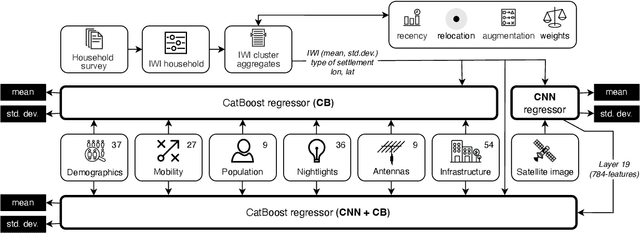
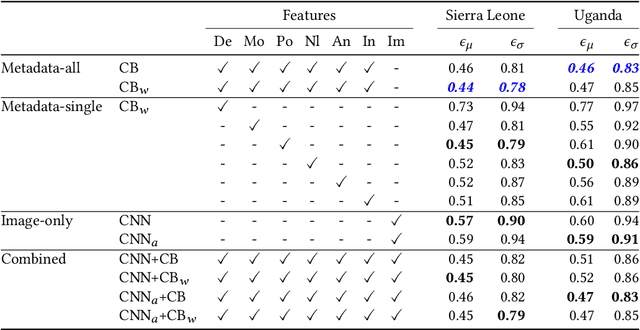
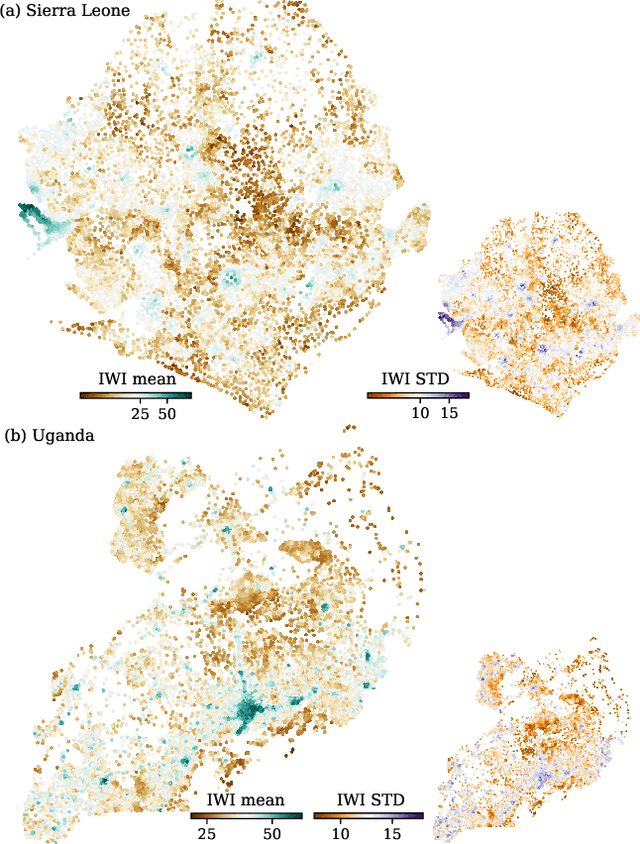
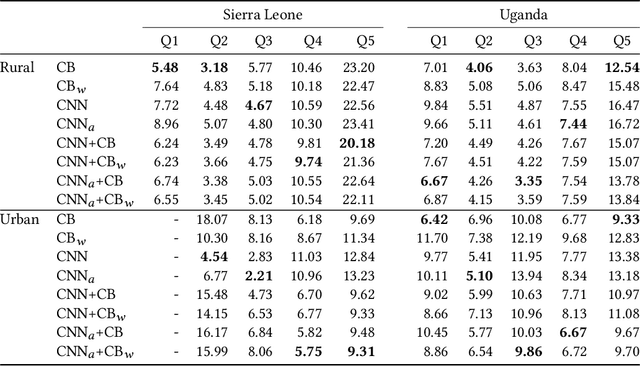
Poverty maps are essential tools for governments and NGOs to track socioeconomic changes and adequately allocate infrastructure and services in places in need. Sensor and online crowd-sourced data combined with machine learning methods have provided a recent breakthrough in poverty map inference. However, these methods do not capture local wealth fluctuations, and are not optimized to produce accountable results that guarantee accurate predictions to all sub-populations. Here, we propose a pipeline of machine learning models to infer the mean and standard deviation of wealth across multiple geographically clustered populated places, and illustrate their performance in Sierra Leone and Uganda. These models leverage seven independent and freely available feature sources based on satellite images, and metadata collected via online crowd-sourcing and social media. Our models show that combined metadata features are the best predictors of wealth in rural areas, outperforming image-based models, which are the best for predicting the highest wealth quintiles. Our results recover the local mean and variation of wealth, and correctly capture the positive yet non-monotonous correlation between them. We further demonstrate the capabilities and limitations of model transfer across countries and the effects of data recency and other biases. Our methodology provides open tools to build towards more transparent and interpretable models to help governments and NGOs to make informed decisions based on data availability, urbanization level, and poverty thresholds.
 Add to Chrome
 Add to Firefox
 Add to Edge