Identifying similarity and anomalies for cryptocurrency moments and distribution extremities
Paper and Code
Jan 26, 2020


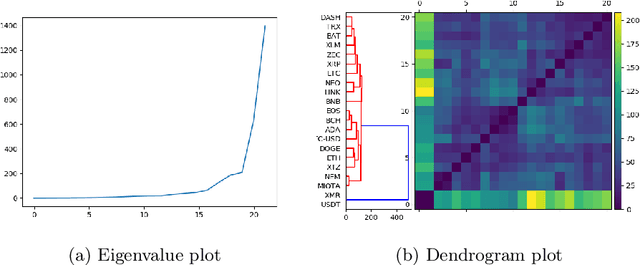
We propose two new methods for identifying similarity and anomalies among collections of time series, and apply these methods to analyse cryptocurrencies. First, we analyse change points with respect to various distribution moments, considering these points as signals of erratic behaviour and potential risk. This technique uses the MJ$_1$ semi-metric, from the more general MJ$_p$ class of semi-metrics \citep{James2019}, to measure distance between these change point sets. Prior work on this topic fails to consider data between change points, and in particular, does not justify the utility of this change point analysis. Therefore, we introduce a second method to determine similarity between time series, in this instance with respect to their extreme values, or tail behaviour. Finally, we measure the consistency between our two methods, that is, structural break versus tail behaviour similarity. With cryptocurrency investment as an apt example of erratic, extreme behaviour, we notice an impressive consistency between these two methods.
 Add to Chrome
 Add to Firefox
 Add to Edge