Exploring time-series motifs through DTW-SOM
Paper and Code
Apr 17, 2020


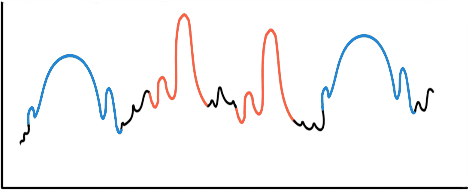
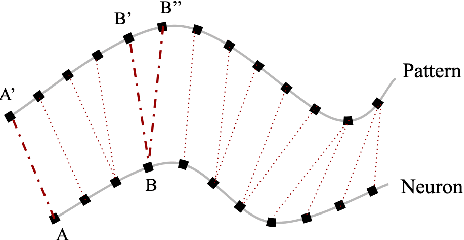
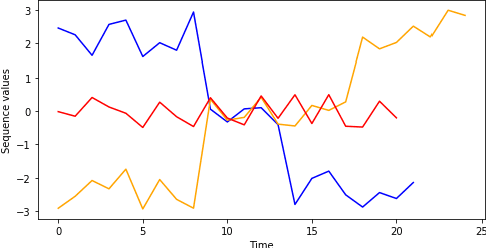
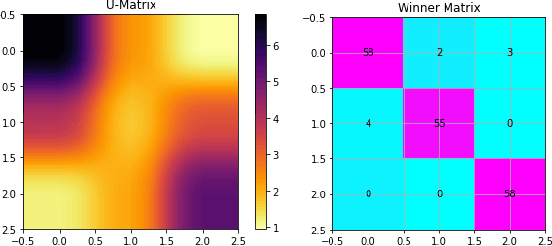
Motif discovery is a fundamental step in data mining tasks for time-series data such as clustering, classification and anomaly detection. Even though many papers have addressed the problem of how to find motifs in time-series by proposing new motif discovery algorithms, not much work has been done on the exploration of the motifs extracted by these algorithms. In this paper, we argue that visually exploring time-series motifs computed by motif discovery algorithms can be useful to understand and debug results. To explore the output of motif discovery algorithms, we propose the use of an adapted Self-Organizing Map, the DTW-SOM, on the list of motif's centers. In short, DTW-SOM is a vanilla Self-Organizing Map with three main differences, namely (1) the use the Dynamic Time Warping distance instead of the Euclidean distance, (2) the adoption of two new network initialization routines (a random sample initialization and an anchor initialization) and (3) the adjustment of the Adaptation phase of the training to work with variable-length time-series sequences. We test DTW-SOM in a synthetic motif dataset and two real time-series datasets from the UCR Time Series Classification Archive. After an exploration of results, we conclude that DTW-SOM is capable of extracting relevant information from a set of motifs and display it in a visualization that is space-efficient.
 Add to Chrome
 Add to Firefox
 Add to Edge