Examining the Difference Among Transformers and CNNs with Explanation Methods
Paper and Code
Dec 15, 2022


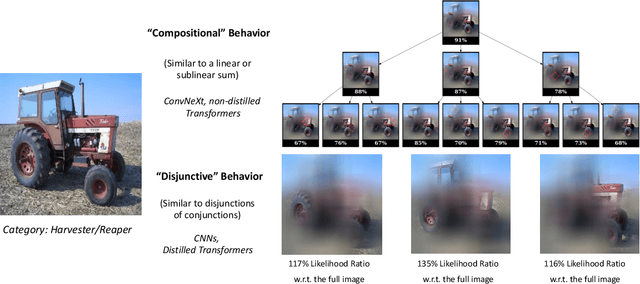
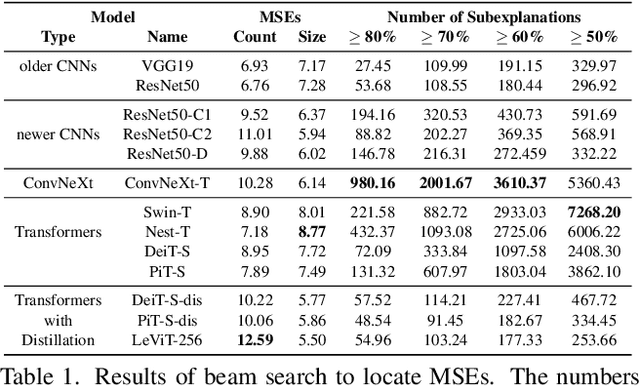
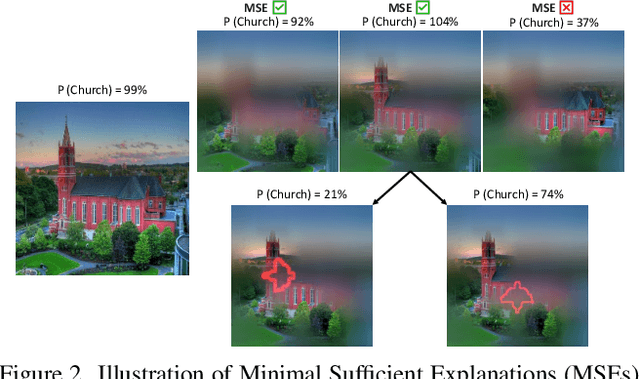
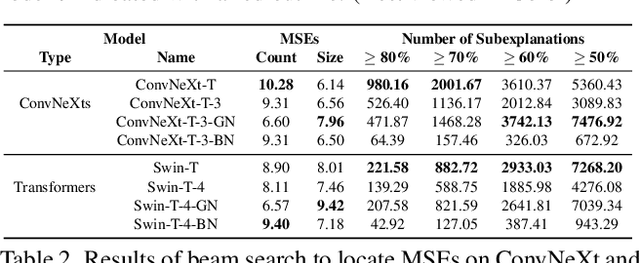
We propose a methodology that systematically applies deep explanation algorithms on a dataset-wide basis, to compare different types of visual recognition backbones, such as convolutional networks (CNNs), global attention networks, and local attention networks. Examination of both qualitative visualizations and quantitative statistics across the dataset helps us to gain intuitions that are not just anecdotal, but are supported by the statistics computed on the entire dataset. Specifically, we propose two methods. The first one, sub-explanation counting, systematically searches for minimally-sufficient explanations of all images and count the amount of sub-explanations for each network. The second one, called cross-testing, computes salient regions using one network and then evaluates the performance by only showing these regions as an image to other networks. Through a combination of qualitative insights and quantitative statistics, we illustrate that 1) there are significant differences between the salient features of CNNs and attention models; 2) the occlusion-robustness in local attention models and global attention models may come from different decision-making mechanisms.
 Add to Chrome
 Add to Firefox
 Add to Edge