Evaluating Bayesian Model Visualisations
Paper and Code
Jan 10, 2022


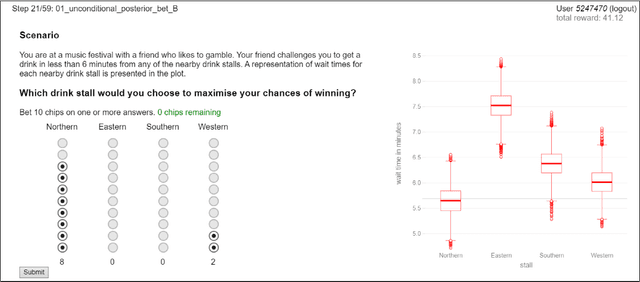
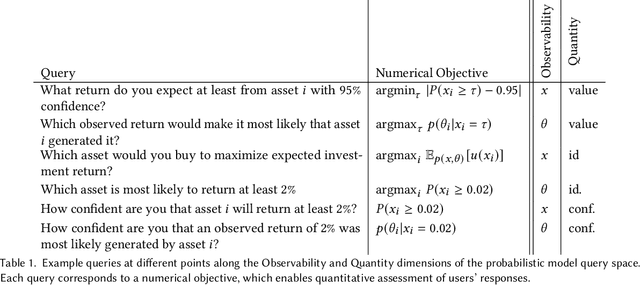
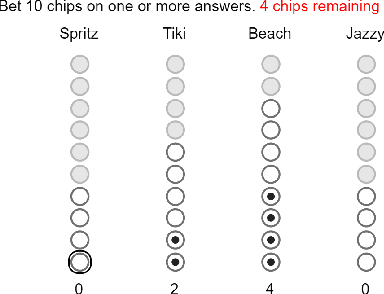
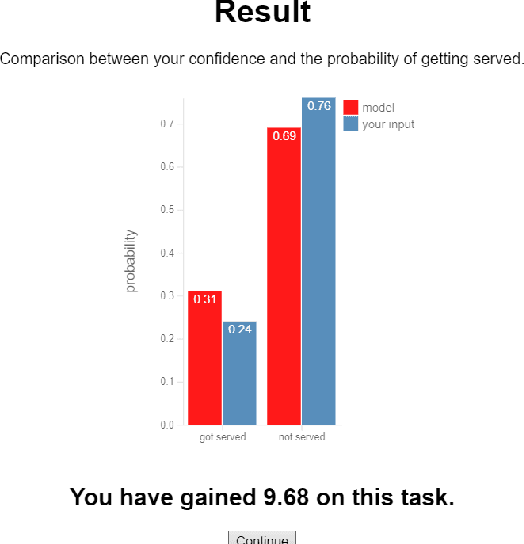
Probabilistic models inform an increasingly broad range of business and policy decisions ultimately made by people. Recent algorithmic, computational, and software framework development progress facilitate the proliferation of Bayesian probabilistic models, which characterise unobserved parameters by their joint distribution instead of point estimates. While they can empower decision makers to explore complex queries and to perform what-if-style conditioning in theory, suitable visualisations and interactive tools are needed to maximise users' comprehension and rational decision making under uncertainty. In this paper, propose a protocol for quantitative evaluation of Bayesian model visualisations and introduce a software framework implementing this protocol to support standardisation in evaluation practice and facilitate reproducibility. We illustrate the evaluation and analysis workflow on a user study that explores whether making Boxplots and Hypothetical Outcome Plots interactive can increase comprehension or rationality and conclude with design guidelines for researchers looking to conduct similar studies in the future.
 Add to Chrome
 Add to Firefox
 Add to Edge