Does the dataset meet your expectations? Explaining sample representation in image data
Paper and Code
Dec 06, 2020


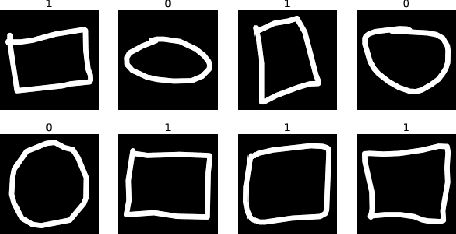
Since the behavior of a neural network model is adversely affected by a lack of diversity in training data, we present a method that identifies and explains such deficiencies. When a dataset is labeled, we note that annotations alone are capable of providing a human interpretable summary of sample diversity. This allows explaining any lack of diversity as the mismatch found when comparing the \textit{actual} distribution of annotations in the dataset with an \textit{expected} distribution of annotations, specified manually to capture essential label diversity. While, in many practical cases, labeling (samples $\rightarrow$ annotations) is expensive, its inverse, simulation (annotations $\rightarrow$ samples) can be cheaper. By mapping the expected distribution of annotations into test samples using parametric simulation, we present a method that explains sample representation using the mismatch in diversity between simulated and collected data. We then apply the method to examine a dataset of geometric shapes to qualitatively and quantitatively explain sample representation in terms of comprehensible aspects such as size, position, and pixel brightness.
 Add to Chrome
 Add to Firefox
 Add to Edge