Clustering high dimensional meteorological scenarios: results and performance index
Paper and Code
Dec 14, 2020


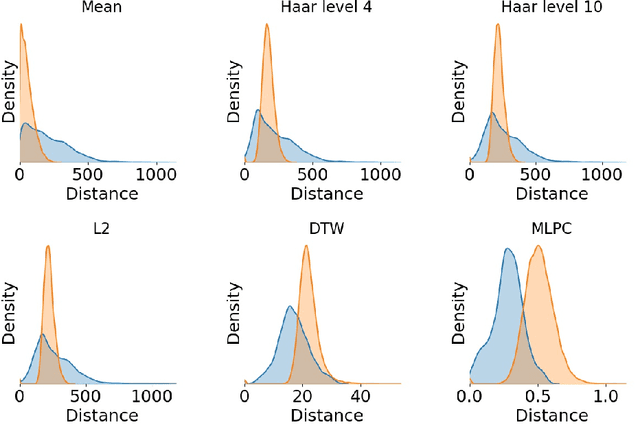
The Reseau de Transport d'Electricit\'e (RTE) is the French main electricity network operational manager and dedicates large number of resources and efforts towards understanding climate time series data. We discuss here the problem and the methodology of grouping and selecting representatives of possible climate scenarios among a large number of climate simulations provided by RTE. The data used is composed of temperature times series for 200 different possible scenarios on a grid of geographical locations in France. These should be clustered in order to detect common patterns regarding temperatures curves and help to choose representative scenarios for network simulations, which in turn can be used for energy optimisation. We first show that the choice of the distance used for the clustering has a strong impact on the meaning of the results: depending on the type of distance used, either spatial or temporal patterns prevail. Then we discuss the difficulty of fine-tuning the distance choice (combined with a dimension reduction procedure) and we propose a methodology based on a carefully designed index.
 Add to Chrome
 Add to Firefox
 Add to Edge