Thomas A. Cooke
Unsupervised clustering of disturbances in power systems via deep convolutional autoencoders
Jun 08, 2023


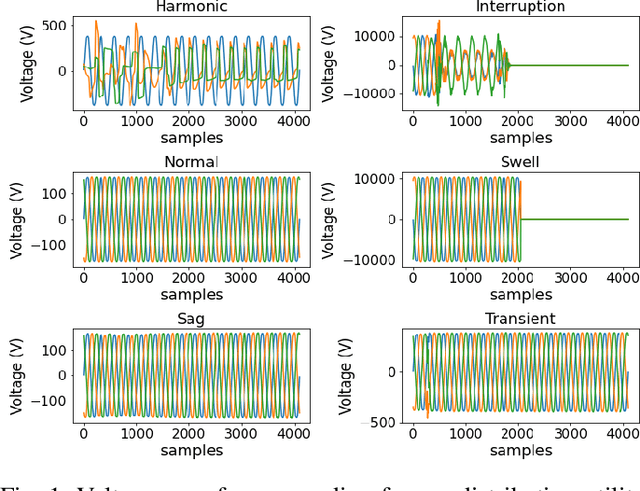
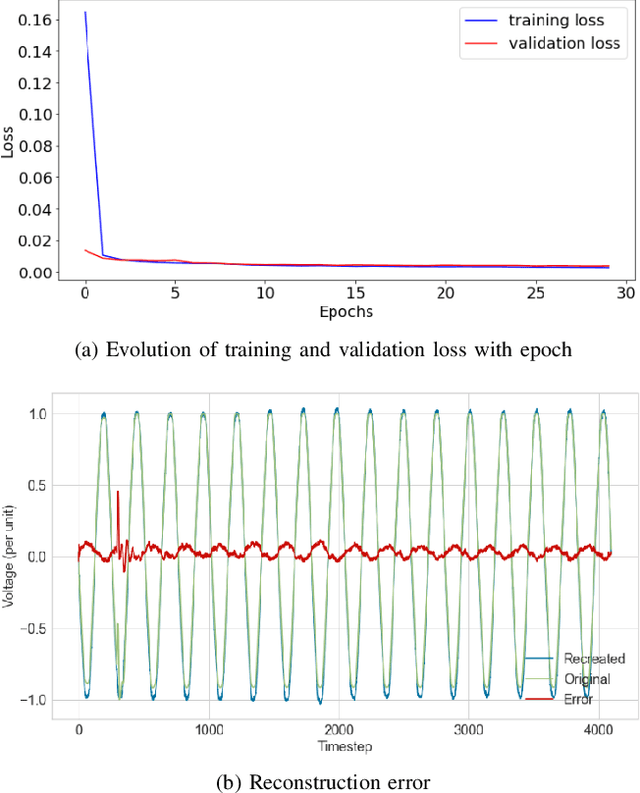
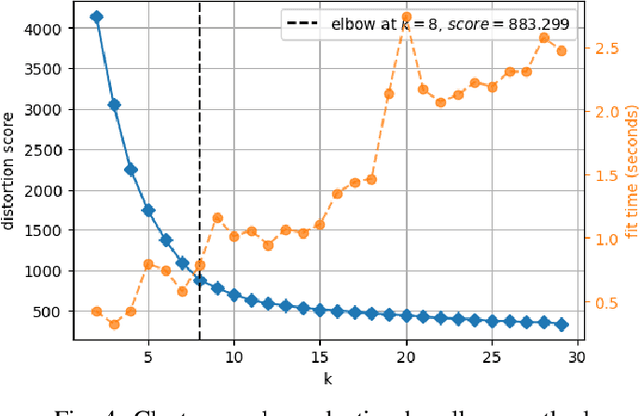
Abstract:Power quality (PQ) events are recorded by PQ meters whenever anomalous events are detected on the power grid. Using neural networks with machine learning can aid in accurately classifying the recorded waveforms and help power system engineers diagnose and rectify the root causes of problems. However, many of the waveforms captured during a disturbance in the power system need to be labeled for supervised learning, leaving a large number of data recordings for engineers to process manually or go unseen. This paper presents an autoencoder and K-means clustering-based unsupervised technique that can be used to cluster PQ events into categories like sag, interruption, transients, normal, and harmonic distortion to enable filtering of anomalous waveforms from recurring or normal waveforms. The method is demonstrated using three-phase, field-obtained voltage waveforms recorded in a distribution grid. First, a convolutional autoencoder compresses the input signals into a set of lower feature dimensions which, after further processing, is passed to the K-means algorithm to identify data clusters. Using a small, labeled dataset, numerical labels are then assigned to events based on a cosine similarity analysis. Finally, the study analyzes the clusters using the t-distributed stochastic neighbor embedding (t-SNE) visualization tool, demonstrating that the technique can help investigate a large number of captured events in a quick manner.
 Add to Chrome
 Add to Firefox
 Add to Edge