Ryuji Watanabe
Visual analytics of set data for knowledge discovery and member selection support
Apr 04, 2021


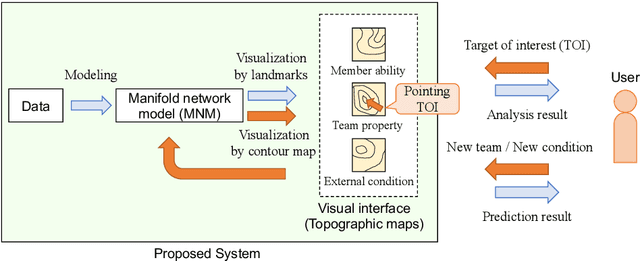
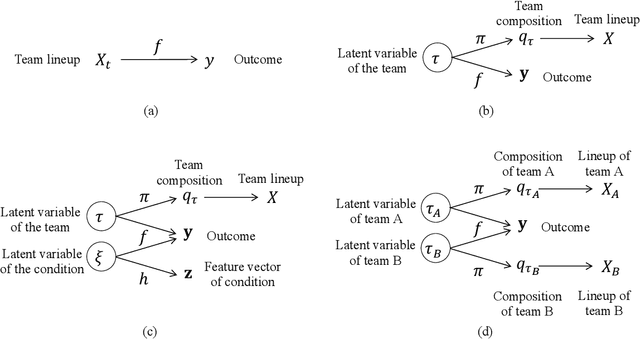
Abstract:Visual analytics (VA) is a visually assisted exploratory analysis approach in which knowledge discovery is executed interactively between the user and system. The purpose of this study is to develop a method for the VA of set data aimed at supporting knowledge discovery and member selection. A typical target application is a visual support system for team analysis and member selection, by which users can analyze past teams and examine candidate lineups for new teams. Because there are several difficulties, such as the combinatorial explosion problem, developing a VA system of set data is challenging. In this study, we first define the requirements that the target system should satisfy and clarify the accompanying challenges. Then we propose a method for the VA of set data, which satisfies the requirements. The key idea is to model the generation process of sets and their outputs using a manifold network model. The proposed method visualizes the relevant factors as a set of topographic maps on which various information is visualized. Furthermore, using the topographic maps as a bidirectional interface, users can indicate their targets of interest in the system on these maps. We demonstrate the proposed method by applying it to basketball teams, showing how past teams are analyzed and how new lineups are examined. Because the method can be adapted to individual application cases by extending the network structure, it can be a general method by which practical systems can be built.
 Add to Chrome
 Add to Firefox
 Add to Edge