Per B. Brockhoff
Forest Floor Visualizations of Random Forests
Jul 04, 2016


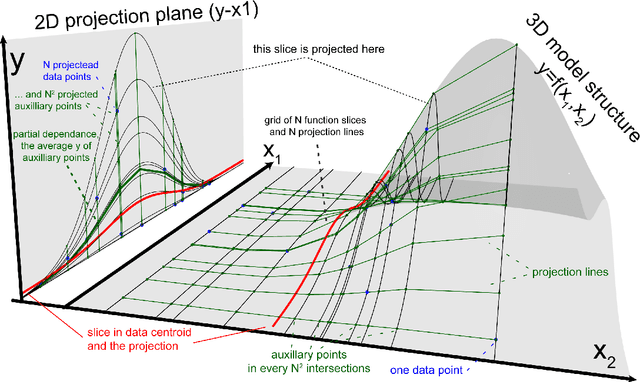
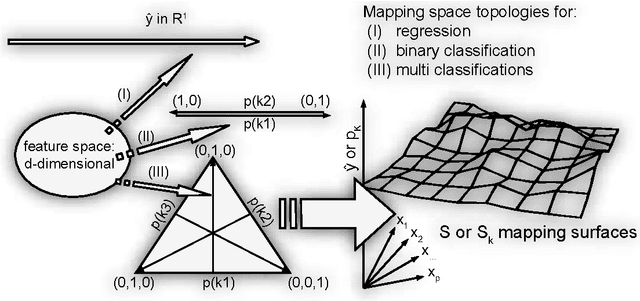
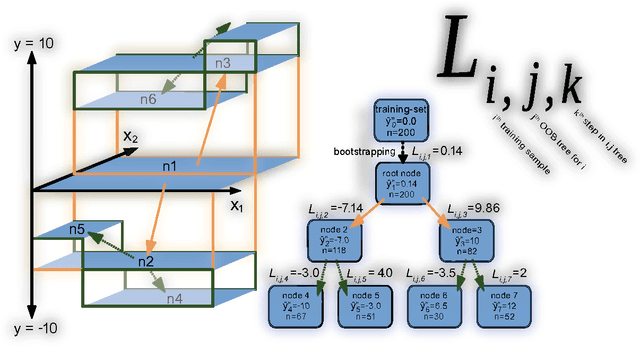
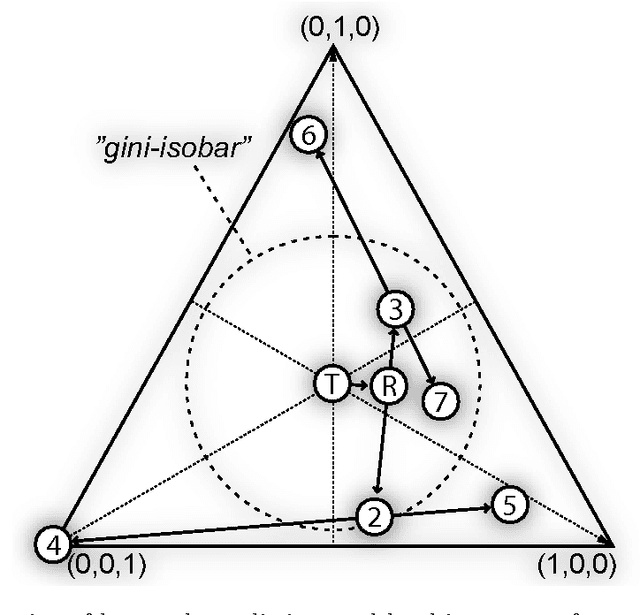
Abstract:We propose a novel methodology, forest floor, to visualize and interpret random forest (RF) models. RF is a popular and useful tool for non-linear multi-variate classification and regression, which yields a good trade-off between robustness (low variance) and adaptiveness (low bias). Direct interpretation of a RF model is difficult, as the explicit ensemble model of hundreds of deep trees is complex. Nonetheless, it is possible to visualize a RF model fit by its mapping from feature space to prediction space. Hereby the user is first presented with the overall geometrical shape of the model structure, and when needed one can zoom in on local details. Dimensional reduction by projection is used to visualize high dimensional shapes. The traditional method to visualize RF model structure, partial dependence plots, achieve this by averaging multiple parallel projections. We suggest to first use feature contributions, a method to decompose trees by splitting features, and then subsequently perform projections. The advantages of forest floor over partial dependence plots is that interactions are not masked by averaging. As a consequence, it is possible to locate interactions, which are not visualized in a given projection. Furthermore, we introduce: a goodness-of-visualization measure, use of colour gradients to identify interactions and an out-of-bag cross validated variant of feature contributions.
 Add to Chrome
 Add to Firefox
 Add to Edge