Kenneth W. Fertig
Interval Influence Diagrams
Mar 27, 2013


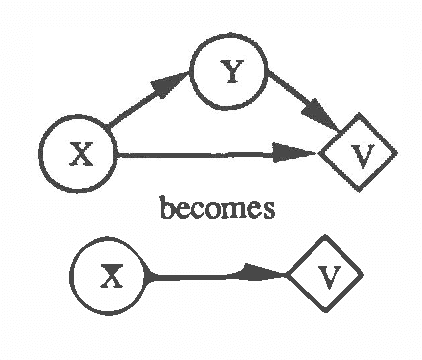
Abstract:We describe a mechanism for performing probabilistic reasoning in influence diagrams using interval rather than point valued probabilities. We derive the procedures for node removal (corresponding to conditional expectation) and arc reversal (corresponding to Bayesian conditioning) in influence diagrams where lower bounds on probabilities are stored at each node. The resulting bounds for the transformed diagram are shown to be optimal within the class of constraints on probability distributions that can be expressed exclusively as lower bounds on the component probabilities of the diagram. Sequences of these operations can be performed to answer probabilistic queries with indeterminacies in the input and for performing sensitivity analysis on an influence diagram. The storage requirements and computational complexity of this approach are comparable to those for point-valued probabilistic inference mechanisms, making the approach attractive for performing sensitivity analysis and where probability information is not available. Limited empirical data on an implementation of the methodology are provided.
Decision Making with Interval Influence Diagrams
Mar 27, 2013


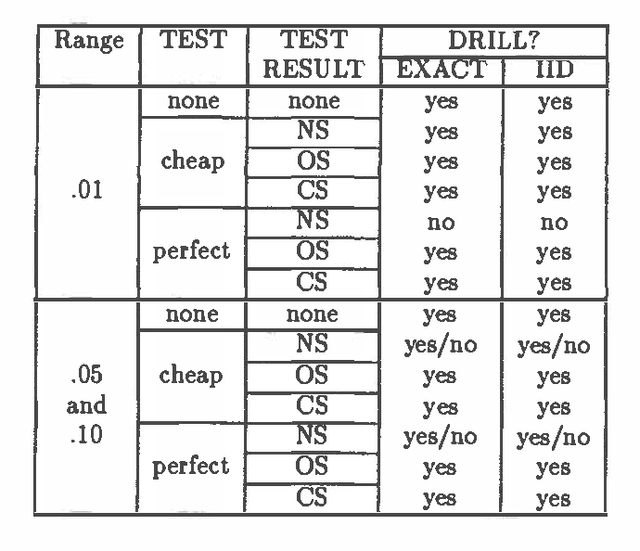
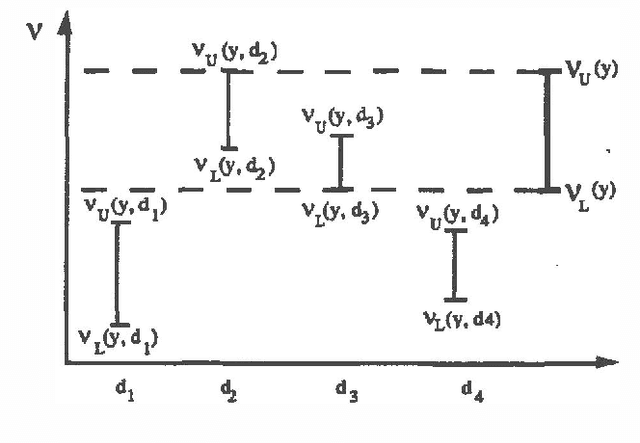
Abstract:In previous work (Fertig and Breese, 1989; Fertig and Breese, 1990) we defined a mechanism for performing probabilistic reasoning in influence diagrams using interval rather than point-valued probabilities. In this paper we extend these procedures to incorporate decision nodes and interval-valued value functions in the diagram. We derive the procedures for chance node removal (calculating expected value) and decision node removal (optimization) in influence diagrams where lower bounds on probabilities are stored at each chance node and interval bounds are stored on the value function associated with the diagram's value node. The output of the algorithm are a set of admissible alternatives for each decision variable and a set of bounds on expected value based on the imprecision in the input. The procedure can be viewed as an approximation to a full e-dimensional sensitivity analysis where n are the number of imprecise probability distributions in the input. We show the transformations are optimal and sound. The performance of the algorithm on an influence diagrams is investigated and compared to an exact algorithm.
 Add to Chrome
 Add to Firefox
 Add to Edge