Kārlis Čerāns
Visual Diagrammatic Queries in ViziQuer: Overview and Implementation
Apr 27, 2023


Abstract:Knowledge graphs (KG) have become an important data organization paradigm. The available textual query languages for information retrieval from KGs, as SPARQL for RDF-structured data, do not provide means for involving non-technical experts in the data access process. Visual query formalisms, alongside form-based and natural language-based ones, offer means for easing user involvement in the data querying process. ViziQuer is a visual query notation and tool offering visual diagrammatic means for describing rich data queries, involving optional and negation constructs, as well as aggregation and subqueries. In this paper we review the visual ViziQuer notation from the end-user point of view and describe the conceptual and technical solutions (including abstract syntax model, followed by a generation model for textual queries) that allow mapping of the visual diagrammatic query notation into the textual SPARQL language, thus enabling the execution of rich visual queries over the actual knowledge graphs. The described solutions demonstrate the viability of the model-based approach in translating complex visual notation into a complex textual one; they serve as semantics by implementation description of the ViziQuer language and provide building blocks for further services in the ViziQuer tool context.
Towards Self-explanatory Ontology Visualization with Contextual Verbalization
Jul 06, 2016


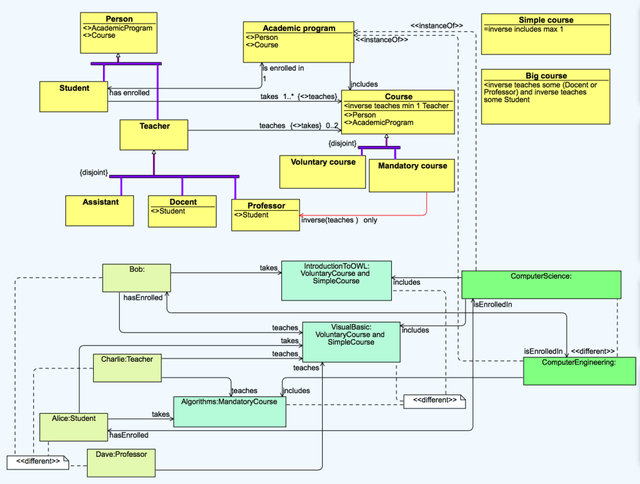
Abstract:Ontologies are one of the core foundations of the Semantic Web. To participate in Semantic Web projects, domain experts need to be able to understand the ontologies involved. Visual notations can provide an overview of the ontology and help users to understand the connections among entities. However, the users first need to learn the visual notation before they can interpret it correctly. Controlled natural language representation would be readable right away and might be preferred in case of complex axioms, however, the structure of the ontology would remain less apparent. We propose to combine ontology visualizations with contextual ontology verbalizations of selected ontology (diagram) elements, displaying controlled natural language (CNL) explanations of OWL axioms corresponding to the selected visual notation elements. Thus, the domain experts will benefit from both the high-level overview provided by the graphical notation and the detailed textual explanations of particular elements in the diagram.
 Add to Chrome
 Add to Firefox
 Add to Edge