Javad T. Firouzjaee
Modeling the Central Supermassive Black Holes Mass of Quasars via LSTM Approach
Jan 04, 2023Abstract:One of the fundamental questions about quasars is related to their central supermassive black holes. The reason for the existence of these black holes with such a huge mass is still unclear and various models have been proposed to explain them. However, there is still no comprehensive explanation that is accepted by the community. The only thing we are sure of is that these black holes were not created by the collapse of giant stars, nor by the accretion of matter around them. Moreover, another important question is the mass distribution of these black holes over time. Observations have shown that if we go back through redshift, we see black holes with more masses, and after passing the peak of star formation redshift, this procedure decreases. Nevertheless, the exact redshift of this peak is still controversial. In this paper, with the help of deep learning and the LSTM algorithm, we tried to find a suitable model for the mass of central black holes of quasars over time by considering QuasarNET data. Our model was built with these data reported from redshift 3 to 7 and for two redshift intervals 0 to 3 and 7 to 10, it predicted the mass of the quasar's central supermassive black holes. We have also tested our model for the specified intervals with observed data from central black holes and discussed the results.
Design interpretable experience of dynamical feed forward machine learning model for forecasting NASDAQ
Dec 22, 2022Abstract:National Association of Securities Dealers Automated Quotations(NASDAQ) is an American stock exchange based. It is one of the most valuable stock economic indices in the world and is located in New York City \cite{pagano2008quality}. The volatility of the stock market and the influence of economic indicators such as crude oil, gold, and the dollar in the stock market, and NASDAQ shares are also affected and have a volatile and chaotic nature \cite{firouzjaee2022lstm}.In this article, we have examined the effect of oil, dollar, gold, and the volatility of the stock market in the economic market, and then we have also examined the effect of these indicators on NASDAQ stocks. Then we started to analyze the impact of the feedback on the past prices of NASDAQ stocks and its impact on the current price. Using PCA and Linear Regression algorithm, we have designed an optimal dynamic learning experience for modeling these stocks. The results obtained from the quantitative analysis are consistent with the results of the qualitative analysis of economic studies, and the modeling done with the optimal dynamic experience of machine learning justifies the current price of NASDAQ shares.
Machine learning model to project the impact of Ukraine crisis
Mar 03, 2022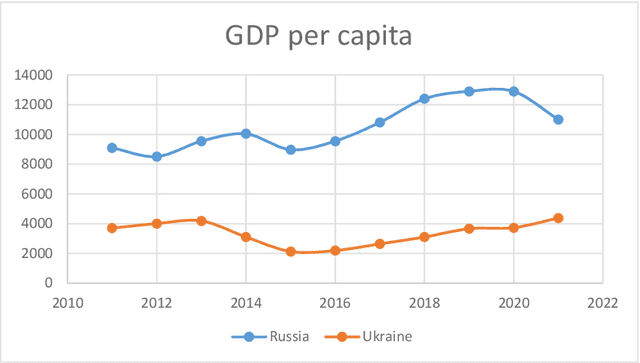
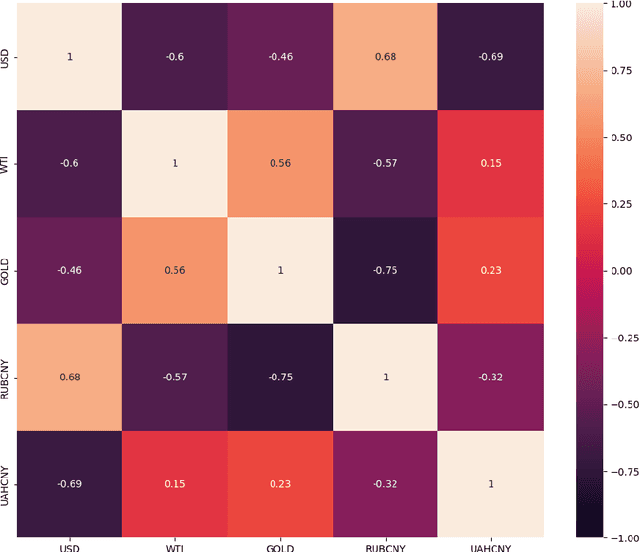
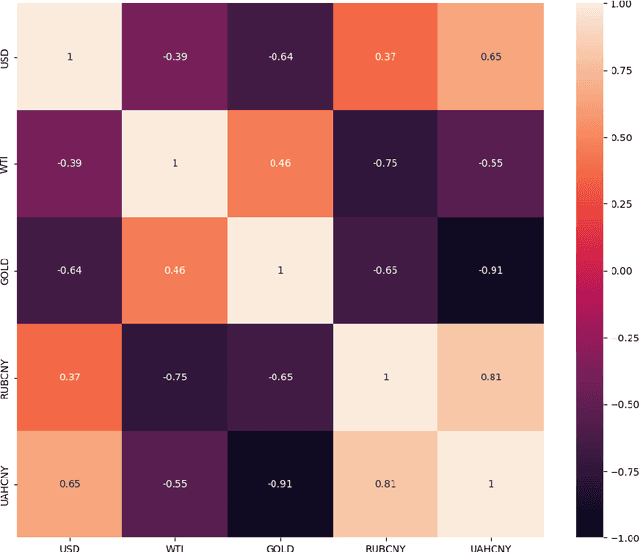
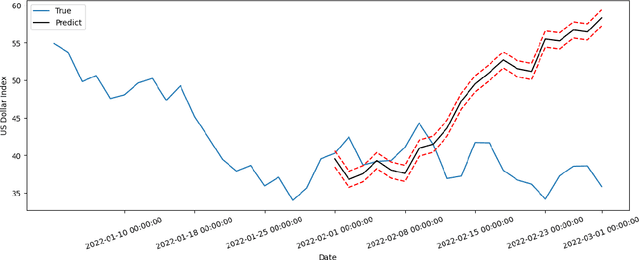
Abstract:Russia's attack on Ukraine on Thursday 24 February 2022 hitched financial markets and the increased geopolitical crisis. In this paper, we select some main economic indexes, such as Gold, Oil (WTI), NDAQ, and known currency which are involved in this crisis and try to find the quantitative effect of this war on them. To quantify the war effect, we use the correlation feature and the relationships between these economic indices, create datasets, and compare the results of forecasts with real data. To study war effects, we use Machine Learning Linear Regression. We carry on empirical experiments and perform on these economic indices datasets to evaluate and predict this war tolls and its effects on main economics indexes.
LSTM Architecture for Oil Stocks Prices Prediction
Jan 02, 2022
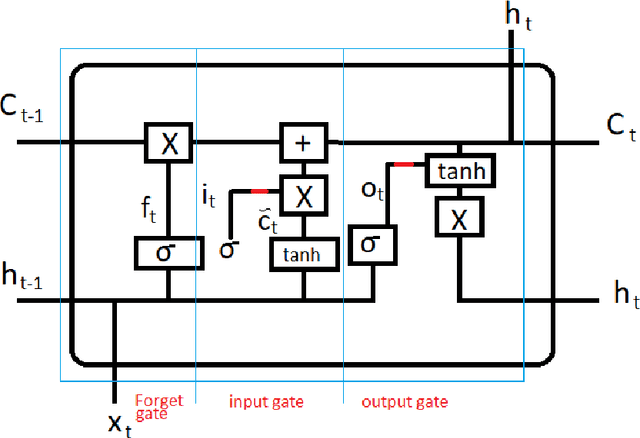
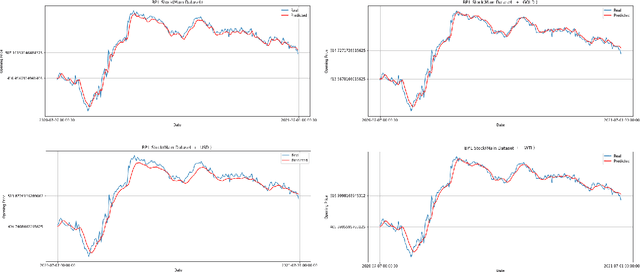
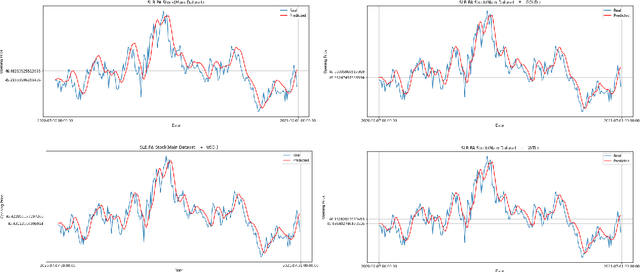
Abstract:Oil companies are among the largest companies in the world whose economic indicators in the global stock market have a great impact on the world economy and market due to their relation to gold, crude oil, and the dollar. To quantify these relations we use the correlation feature and the relationships between stocks with the dollar, crude oil, gold, and major oil company stock indices, we create datasets and compare the results of forecasts with real data. To predict the stocks of different companies, we use Recurrent Neural Networks (RNNs) and LSTM, because these stocks change in time series. We carry on empirical experiments and perform on the stock indices dataset to evaluate the prediction performance in terms of several common error metrics such as Mean Square Error (MSE), Mean Absolute Error (MAE), Root Mean Square Error (RMSE), and Mean Absolute Percentage Error (MAPE). The received results are promising and present a reasonably accurate prediction for the price of oil companies' stocks in the near future. The results show that RNNs do not have the interpretability, and we cannot improve the model by adding any correlated data.
 Add to Chrome
 Add to Firefox
 Add to Edge