Haiqin Wang
User Interface Tools for Navigation in Conditional Probability Tables and Elicitation of Probabilities in Bayesian Networks
Jan 18, 2013


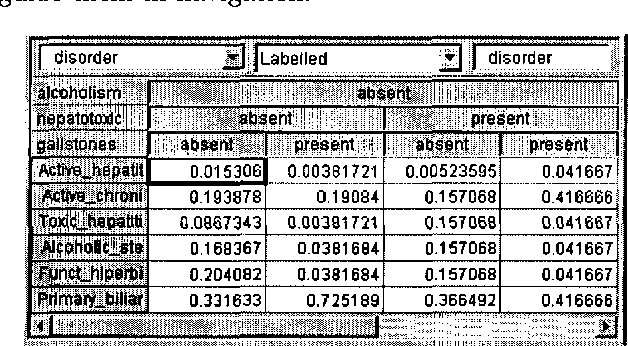
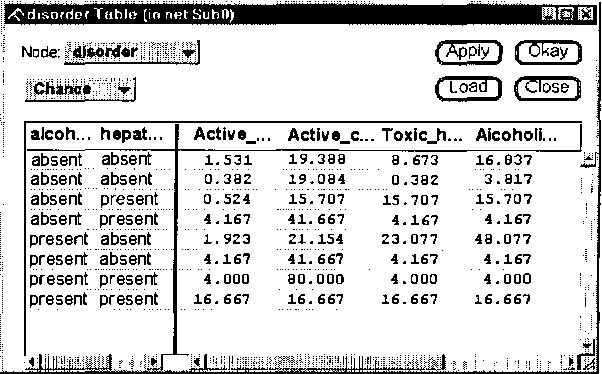
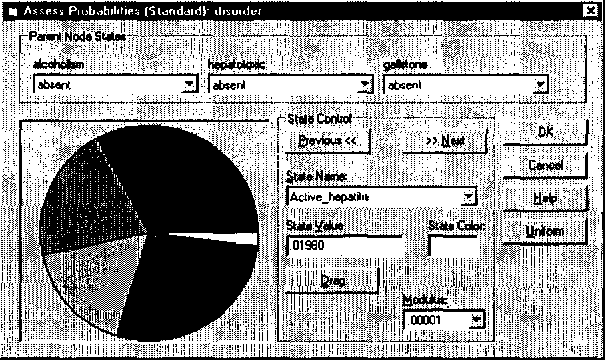
Abstract:Elicitation of probabilities is one of the most laborious tasks in building decision-theoretic models, and one that has so far received only moderate attention in decision-theoretic systems. We propose a set of user interface tools for graphical probabilistic models, focusing on two aspects of probability elicitation: (1) navigation through conditional probability tables and (2) interactive graphical assessment of discrete probability distributions. We propose two new graphical views that aid navigation in very large conditional probability tables: the CPTree (Conditional Probability Tree) and the SCPT (shrinkable Conditional Probability Table). Based on what is known about graphical presentation of quantitative data to humans, we offer several useful enhancements to probability wheel and bar graph, including different chart styles and options that can be adapted to user preferences and needs. We present the results of a simple usability study that proves the value of the proposed tools.
 Add to Chrome
 Add to Firefox
 Add to Edge