Anton Björklund
GRADSTOP: Early Stopping of Gradient Descent via Posterior Sampling
Aug 27, 2025Abstract:Machine learning models are often learned by minimising a loss function on the training data using a gradient descent algorithm. These models often suffer from overfitting, leading to a decline in predictive performance on unseen data. A standard solution is early stopping using a hold-out validation set, which halts the minimisation when the validation loss stops decreasing. However, this hold-out set reduces the data available for training. This paper presents GRADSTOP, a novel stochastic early stopping method that only uses information in the gradients, which are produced by the gradient descent algorithm ``for free.'' Our main contributions are that we estimate the Bayesian posterior by the gradient information, define the early stopping problem as drawing sample from this posterior, and use the approximated posterior to obtain a stopping criterion. Our empirical evaluation shows that GRADSTOP achieves a small loss on test data and compares favourably to a validation-set-based stopping criterion. By leveraging the entire dataset for training, our method is particularly advantageous in data-limited settings, such as transfer learning. It can be incorporated as an optional feature in gradient descent libraries with only a small computational overhead. The source code is available at https://github.com/edahelsinki/gradstop.
Efficient Preimage Approximation for Neural Network Certification
May 28, 2025Abstract:The growing reliance on artificial intelligence in safety- and security-critical applications demands effective neural network certification. A challenging real-world use case is certification against ``patch attacks'', where adversarial patches or lighting conditions obscure parts of images, for example traffic signs. One approach to certification, which also gives quantitative coverage estimates, utilizes preimages of neural networks, i.e., the set of inputs that lead to a specified output. However, these preimage approximation methods, including the state-of-the-art PREMAP algorithm, struggle with scalability. This paper presents novel algorithmic improvements to PREMAP involving tighter bounds, adaptive Monte Carlo sampling, and improved branching heuristics. We demonstrate efficiency improvements of at least an order of magnitude on reinforcement learning control benchmarks, and show that our method scales to convolutional neural networks that were previously infeasible. Our results demonstrate the potential of preimage approximation methodology for reliability and robustness certification.
Using Slisemap to interpret physical data
Oct 24, 2023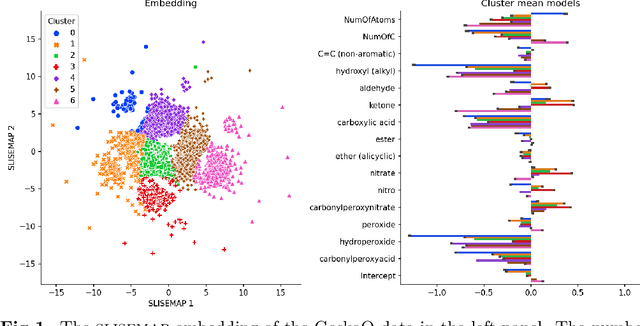
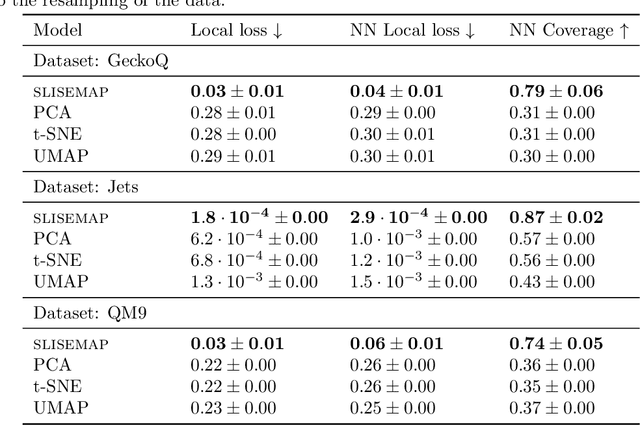
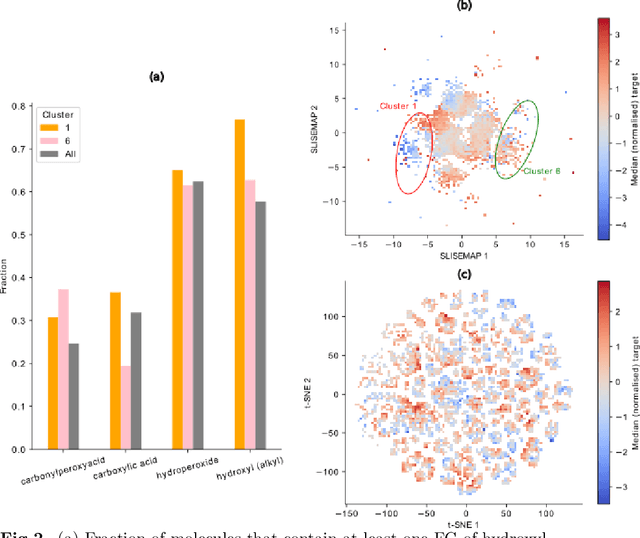
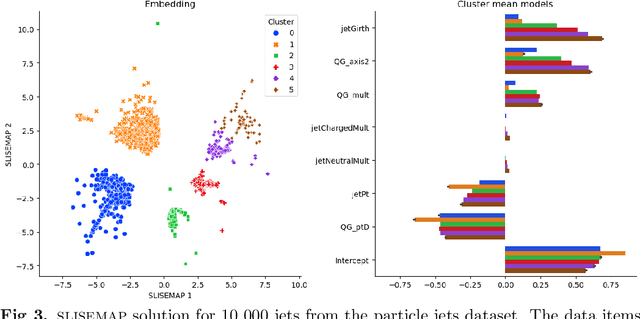
Abstract:Manifold visualisation techniques are commonly used to visualise high-dimensional datasets in physical sciences. In this paper we apply a recently introduced manifold visualisation method, called Slise, on datasets from physics and chemistry. Slisemap combines manifold visualisation with explainable artificial intelligence. Explainable artificial intelligence is used to investigate the decision processes of black box machine learning models and complex simulators. With Slisemap we find an embedding such that data items with similar local explanations are grouped together. Hence, Slisemap gives us an overview of the different behaviours of a black box model. This makes Slisemap into a supervised manifold visualisation method, where the patterns in the embedding reflect a target property. In this paper we show how Slisemap can be used and evaluated on physical data and that Slisemap is helpful in finding meaningful information on classification and regression models trained on these datasets.
SLISEMAP: Explainable Dimensionality Reduction
Jan 12, 2022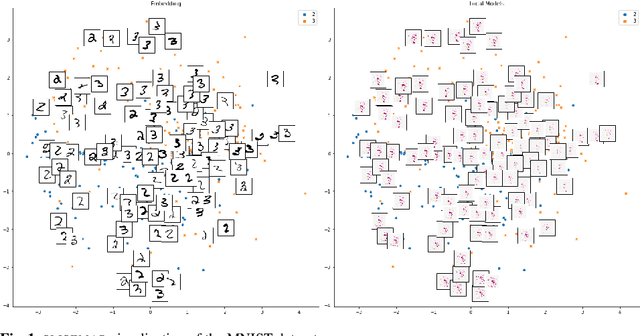
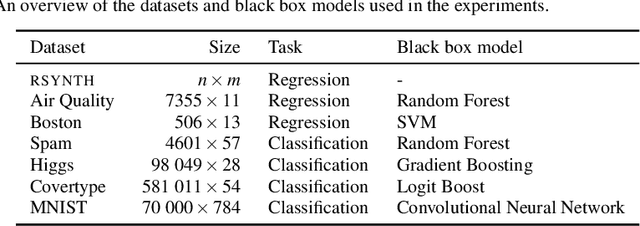
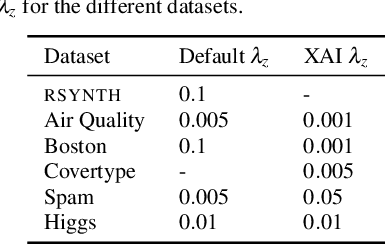
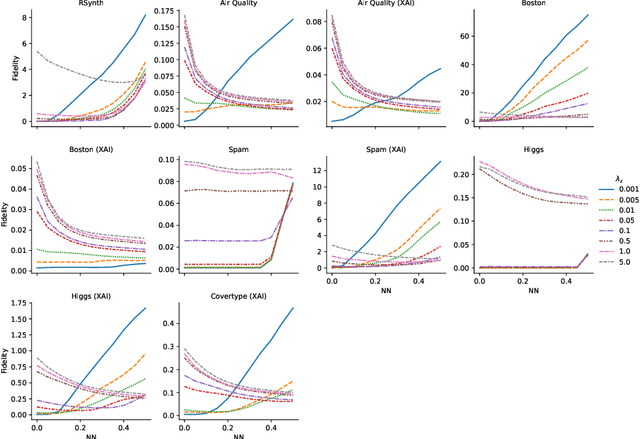
Abstract:Existing explanation methods for black-box supervised learning models generally work by building local models that explain the models behaviour for a particular data item. It is possible to make global explanations, but the explanations may have low fidelity for complex models. Most of the prior work on explainable models has been focused on classification problems, with less attention on regression. We propose a new manifold visualization method, SLISEMAP, that at the same time finds local explanations for all of the data items and builds a two-dimensional visualization of model space such that the data items explained by the same model are projected nearby. We provide an open source implementation of our methods, implemented by using GPU-optimized PyTorch library. SLISEMAP works both on classification and regression models. We compare SLISEMAP to most popular dimensionality reduction methods and some local explanation methods. We provide mathematical derivation of our problem and show that SLISEMAP provides fast and stable visualizations that can be used to explain and understand black box regression and classification models.
 Add to Chrome
 Add to Firefox
 Add to Edge