PCACE: A Statistical Approach to Ranking Neurons for CNN Interpretability
Paper and Code
Dec 31, 2021


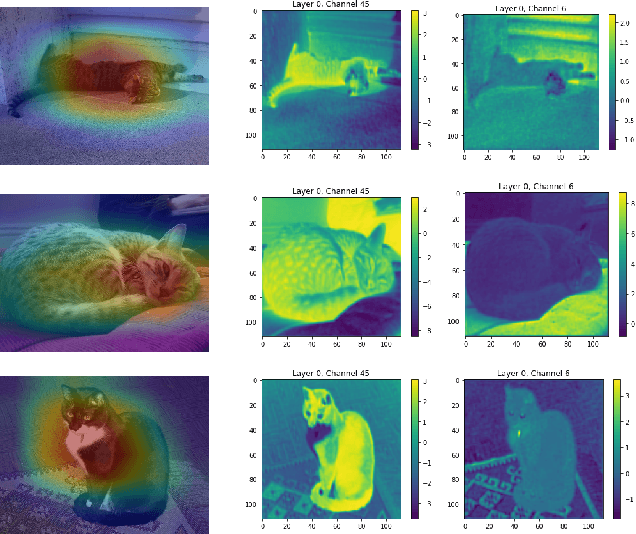
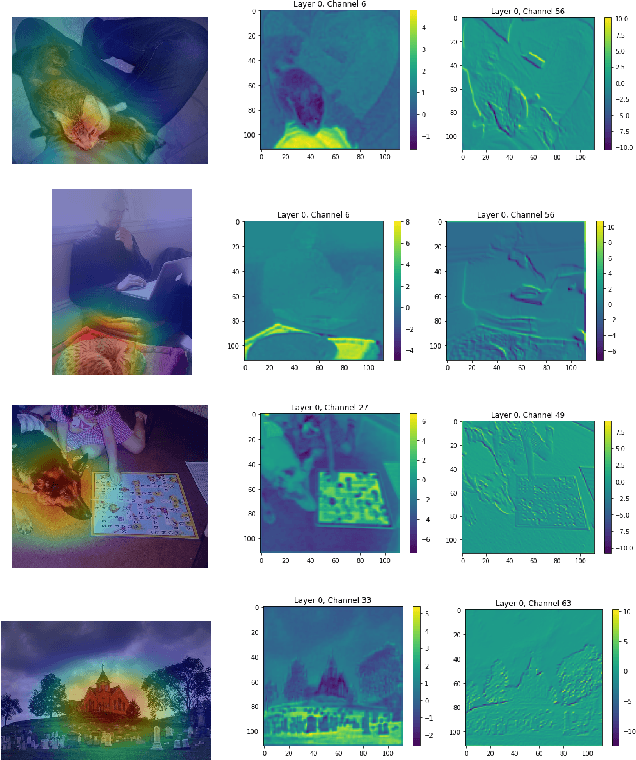
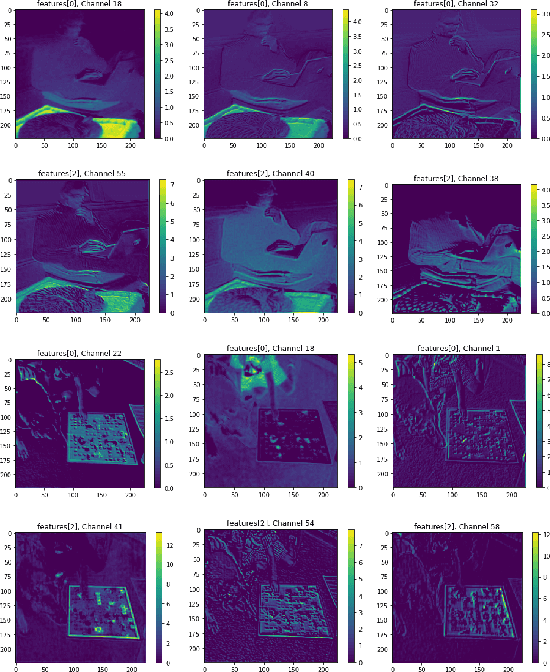
In this paper we introduce a new problem within the growing literature of interpretability for convolution neural networks (CNNs). While previous work has focused on the question of how to visually interpret CNNs, we ask what it is that we care to interpret, that is, which layers and neurons are worth our attention? Due to the vast size of modern deep learning network architectures, automated, quantitative methods are needed to rank the relative importance of neurons so as to provide an answer to this question. We present a new statistical method for ranking the hidden neurons in any convolutional layer of a network. We define importance as the maximal correlation between the activation maps and the class score. We provide different ways in which this method can be used for visualization purposes with MNIST and ImageNet, and show a real-world application of our method to air pollution prediction with street-level images.
 Add to Chrome
 Add to Firefox
 Add to Edge