Interactive Visual Exploration of Topic Models using Graphs
Paper and Code
Nov 27, 2014


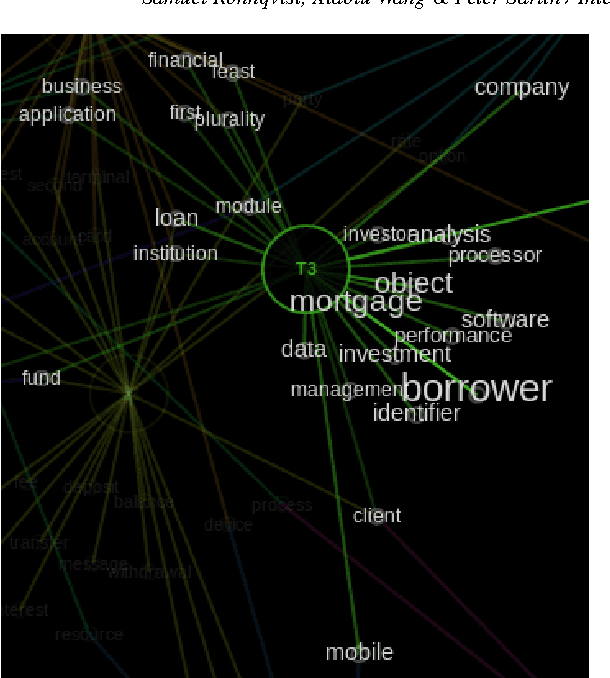
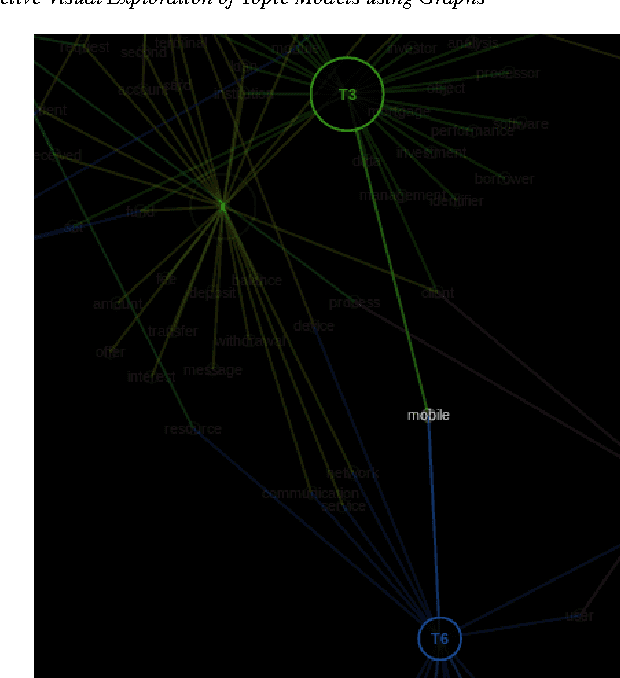
Probabilistic topic modeling is a popular and powerful family of tools for uncovering thematic structure in large sets of unstructured text documents. While much attention has been directed towards the modeling algorithms and their various extensions, comparatively few studies have concerned how to present or visualize topic models in meaningful ways. In this paper, we present a novel design that uses graphs to visually communicate topic structure and meaning. By connecting topic nodes via descriptive keyterms, the graph representation reveals topic similarities, topic meaning and shared, ambiguous keyterms. At the same time, the graph can be used for information retrieval purposes, to find documents by topic or topic subsets. To exemplify the utility of the design, we illustrate its use for organizing and exploring corpora of financial patents.
 Add to Chrome
 Add to Firefox
 Add to Edge