FuNNscope: Visual microscope for interactively exploring the loss landscape of fully connected neural networks
Paper and Code
Apr 09, 2022


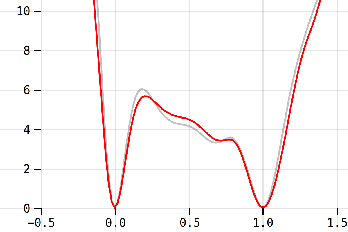
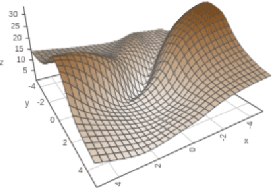
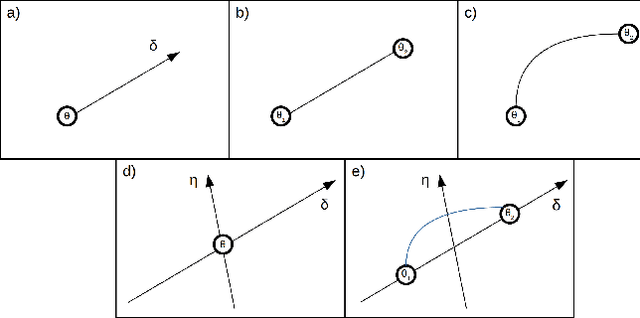
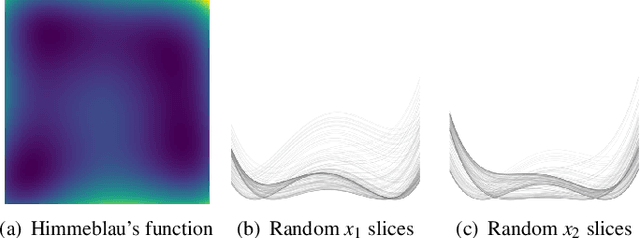
Despite their effective use in various fields, many aspects of neural networks are poorly understood. One important way to investigate the characteristics of neural networks is to explore the loss landscape. However, most models produce a high-dimensional non-convex landscape which is difficult to visualize. We discuss and extend existing visualization methods based on 1D- and 2D slicing with a novel method that approximates the actual loss landscape geometry by using charts with interpretable axes. Based on the assumption that observations on small neural networks can generalize to more complex systems and provide us with helpful insights, we focus on small models in the range of a few dozen weights, which enables computationally cheap experiments and the use of an interactive dashboard. We observe symmetries around the zero vector, the influence of different layers on the global landscape, the different weight sensitivities around a minimizer, and how gradient descent navigates high-loss obstacles. The user study resulted in an average SUS (System Usability Scale) score with suggestions for improvement and opened up a number of possible application scenarios, such as autoencoders and ensemble networks.
 Add to Chrome
 Add to Firefox
 Add to Edge