Explainable Spatial Clustering: Leveraging Spatial Data in Radiation Oncology
Paper and Code
Aug 25, 2020


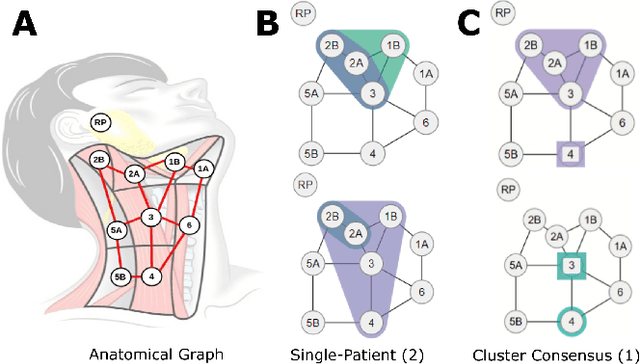
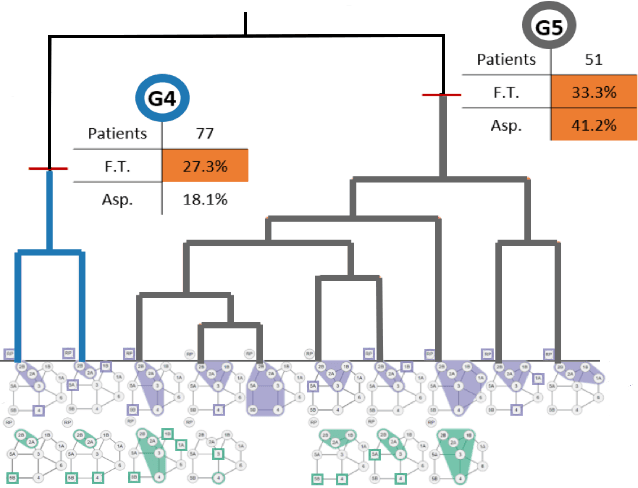
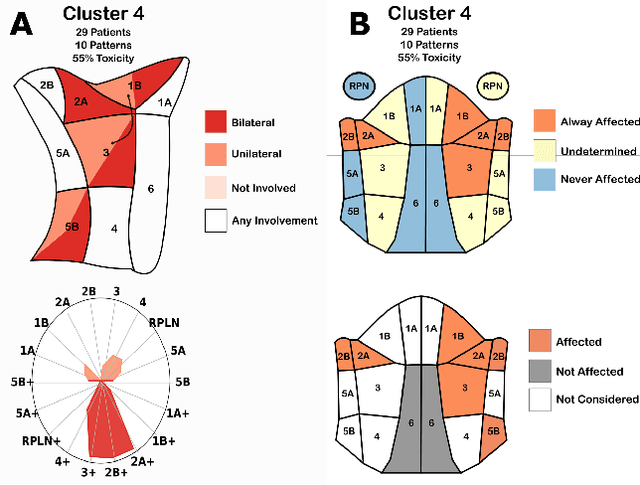
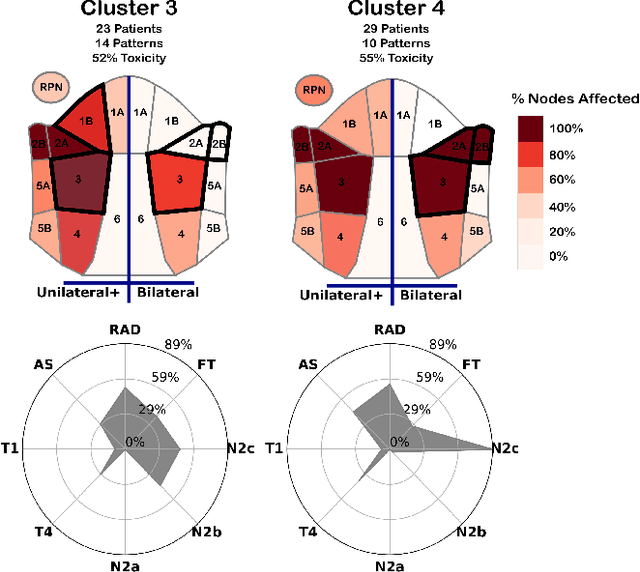
Advances in data collection in radiation therapy have led to an abundance of opportunities for applying data mining and machine learning techniques to promote new data-driven insights. In light of these advances, supporting collaboration between machine learning experts and clinicians is important for facilitating better development and adoption of these models. Although many medical use-cases rely on spatial data, where understanding and visualizing the underlying structure of the data is important, little is known about the interpretability of spatial clustering results by clinical audiences. In this work, we reflect on the design of visualizations for explaining novel approaches to clustering complex anatomical data from head and neck cancer patients. These visualizations were developed, through participatory design, for clinical audiences during a multi-year collaboration with radiation oncologists and statisticians. We distill this collaboration into a set of lessons learned for creating visual and explainable spatial clustering for clinical users.
 Add to Chrome
 Add to Firefox
 Add to Edge