Emosaic: Visualizing Affective Content of Text at Varying Granularity
Paper and Code
Feb 24, 2020


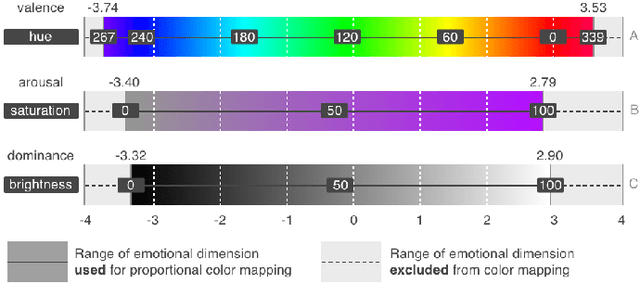
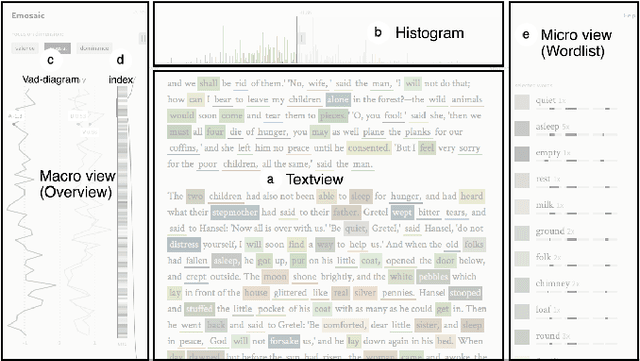
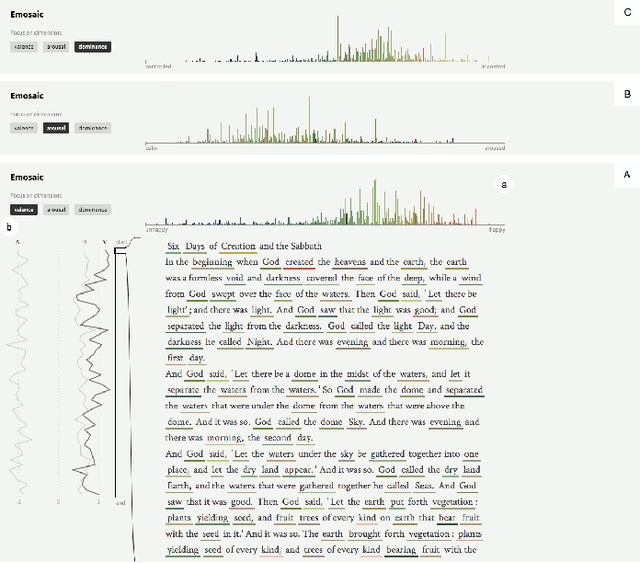
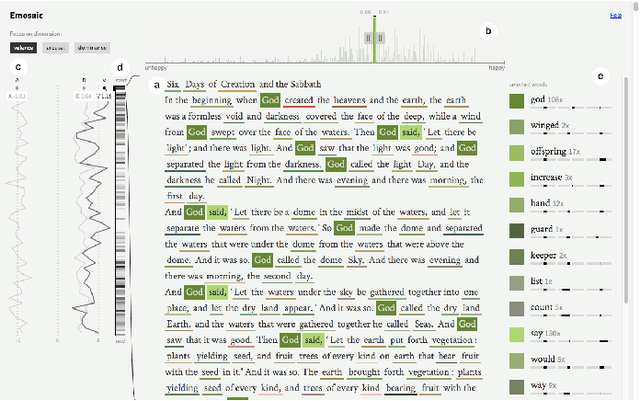
This paper presents Emosaic, a tool for visualizing the emotional tone of text documents, considering multiple dimensions of emotion and varying levels of semantic granularity. Emosaic is grounded in psychological research on the relationship between language, affect, and color perception. We capitalize on an established three-dimensional model of human emotion: valence (good, nice vs. bad, awful), arousal (calm, passive vs. exciting, active) and dominance (weak, controlled vs. strong, in control). Previously, multi-dimensional models of emotion have been used rarely in visualizations of textual data, due to the perceptual challenges involved. Furthermore, until recently most text visualizations remained at a high level, precluding closer engagement with the deep semantic content of the text. Informed by empirical studies, we introduce a color mapping that translates any point in three-dimensional affective space into a unique color. Emosaic uses affective dictionaries of words annotated with the three emotional parameters of the valence-arousal-dominance model to extract emotional meanings from texts and then assigns to them corresponding color parameters of the hue-saturation-brightness color space. This approach of mapping emotion to color is aimed at helping readers to more easily grasp the emotional tone of the text. Several features of Emosaic allow readers to interactively explore the affective content of the text in more detail; e.g., in aggregated form as histograms, in sequential form following the order of text, and in detail embedded into the text display itself. Interaction techniques have been included to allow for filtering and navigating of text and visualizations.
 Add to Chrome
 Add to Firefox
 Add to Edge