Distinguishing noise from chaos: objective versus subjective criteria using Horizontal Visibility Graph
Paper and Code
Jan 09, 2014


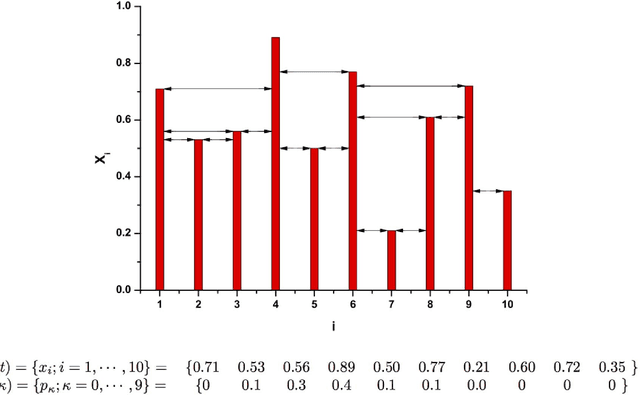
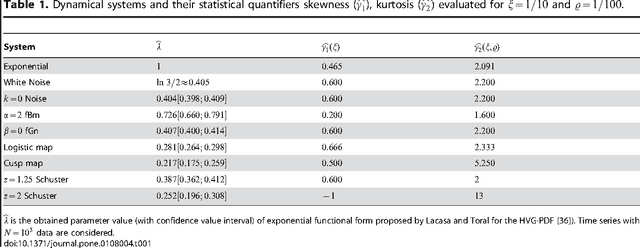
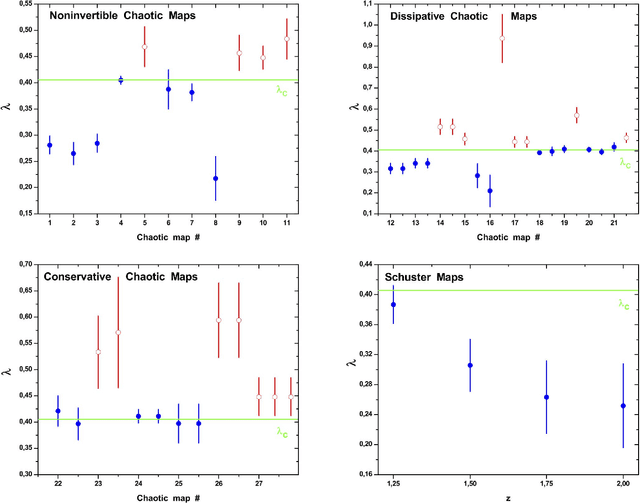
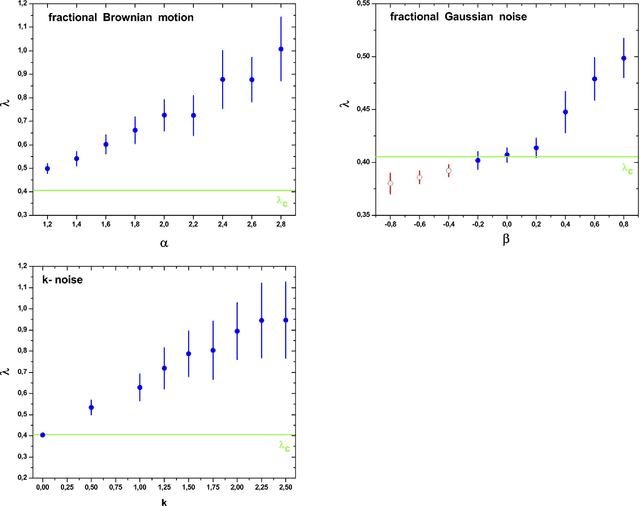
A recently proposed methodology called the Horizontal Visibility Graph (HVG) [Luque {\it et al.}, Phys. Rev. E., 80, 046103 (2009)] that constitutes a geometrical simplification of the well known Visibility Graph algorithm [Lacasa {\it et al.\/}, Proc. Natl. Sci. U.S.A. 105, 4972 (2008)], has been used to study the distinction between deterministic and stochastic components in time series [L. Lacasa and R. Toral, Phys. Rev. E., 82, 036120 (2010)]. Specifically, the authors propose that the node degree distribution of these processes follows an exponential functional of the form $P(\kappa)\sim \exp(-\lambda~\kappa)$, in which $\kappa$ is the node degree and $\lambda$ is a positive parameter able to distinguish between deterministic (chaotic) and stochastic (uncorrelated and correlated) dynamics. In this work, we investigate the characteristics of the node degree distributions constructed by using HVG, for time series corresponding to $28$ chaotic maps and $3$ different stochastic processes. We thoroughly study the methodology proposed by Lacasa and Toral finding several cases for which their hypothesis is not valid. We propose a methodology that uses the HVG together with Information Theory quantifiers. An extensive and careful analysis of the node degree distributions obtained by applying HVG allow us to conclude that the Fisher-Shannon information plane is a remarkable tool able to graphically represent the different nature, deterministic or stochastic, of the systems under study.
 Add to Chrome
 Add to Firefox
 Add to Edge