Beyond Importance Scores: Interpreting Tabular ML by Visualizing Feature Semantics
Paper and Code
Nov 30, 2021


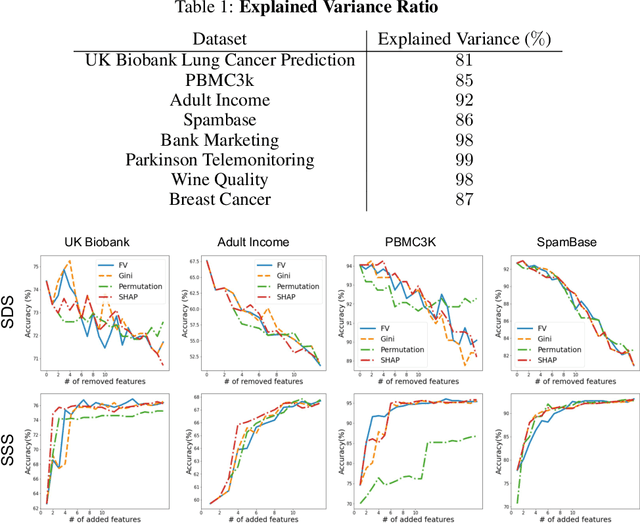
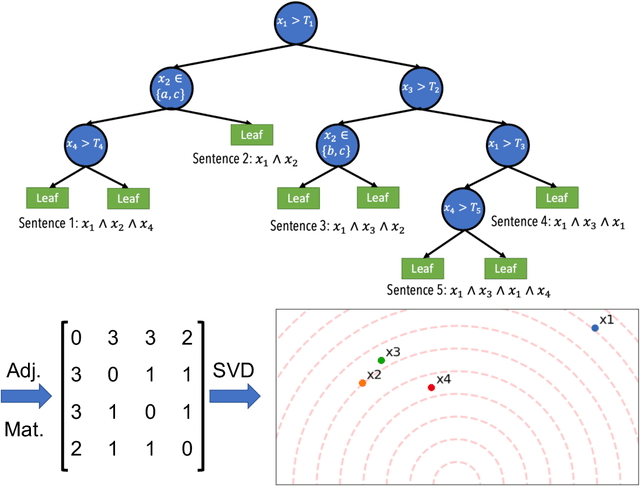
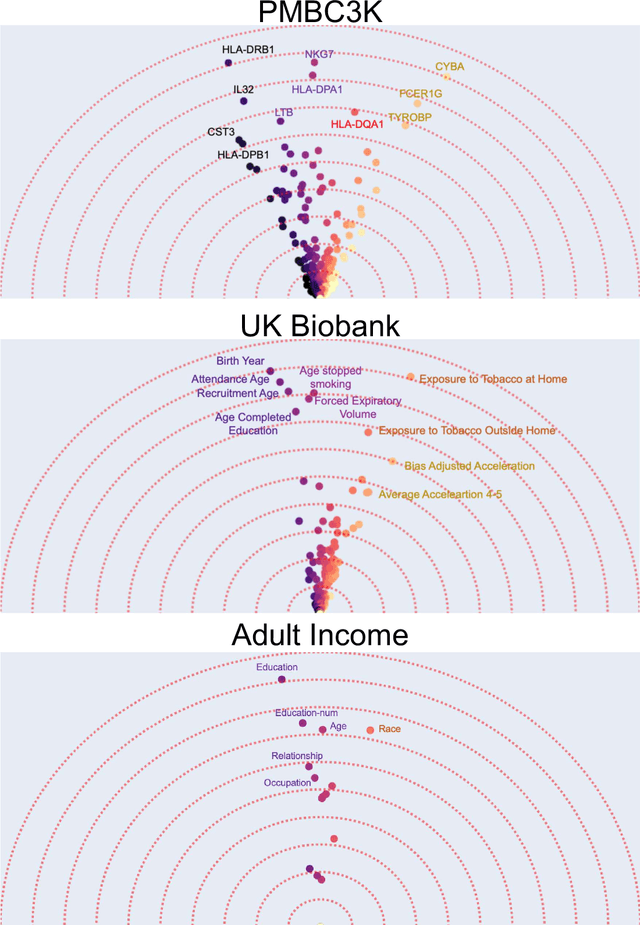
Interpretability is becoming an active research topic as machine learning (ML) models are more widely used to make critical decisions. Tabular data is one of the most commonly used modes of data in diverse applications such as healthcare and finance. Much of the existing interpretability methods used for tabular data only report feature-importance scores -- either locally (per example) or globally (per model) -- but they do not provide interpretation or visualization of how the features interact. We address this limitation by introducing Feature Vectors, a new global interpretability method designed for tabular datasets. In addition to providing feature-importance, Feature Vectors discovers the inherent semantic relationship among features via an intuitive feature visualization technique. Our systematic experiments demonstrate the empirical utility of this new method by applying it to several real-world datasets. We further provide an easy-to-use Python package for Feature Vectors.
 Add to Chrome
 Add to Firefox
 Add to Edge