ANOVA exemplars for understanding data drift
Paper and Code
Jun 24, 2020


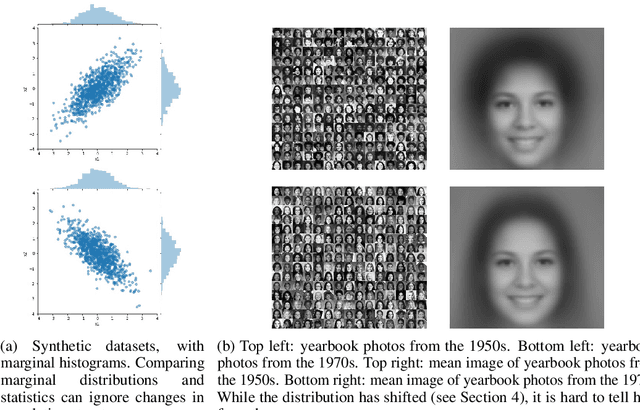
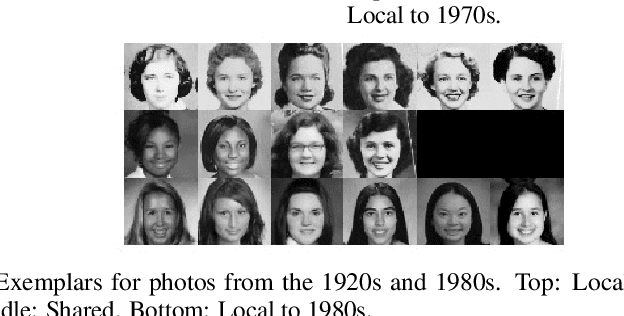
The distributions underlying complex datasets, such as images, text or tabular data, are often difficult to visualize in terms of summary statistics such as the mean or the marginal standard deviations. Instead, a small set of exemplars or prototypes---real or synthetic data points that are in some sense representative of the entire distribution---can be used to provide a human-interpretable summary of the distribution. In many situations, we are interested in understanding the \textit{difference} between two distributions. For example, we may be interested in identifying and characterizing data drift over time, or the difference between two related datasets. While exemplars are often more easily understood than high-dimensional summary statistics, they are harder to compare. To solve this problem, we introduce ANOVA exemplars. Rather than independently find exemplars $S_X$ and $S_Y$ for two datasets $X$ and $Y$, we aim to find exemplars that are both representative of $X$ and $Y$, and that maximize the overlap $|S_X\cap S_Y|$ between the two sets of exemplars. We can then use the differences between the two sets of exemplars to describe the difference between the distributions of $X$ and $Y$, in a concise, interpretable manner.
 Add to Chrome
 Add to Firefox
 Add to Edge