AI Total: Analyzing Security ML Models with Imperfect Data in Production
Paper and Code
Oct 13, 2021


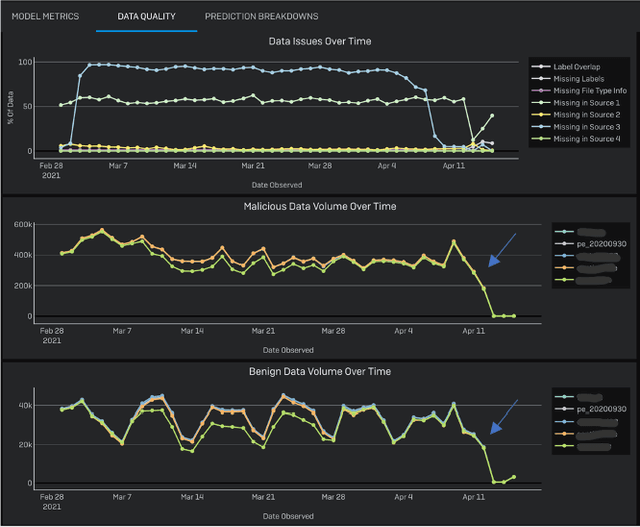
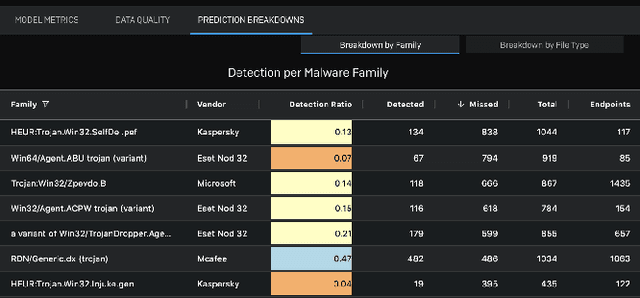
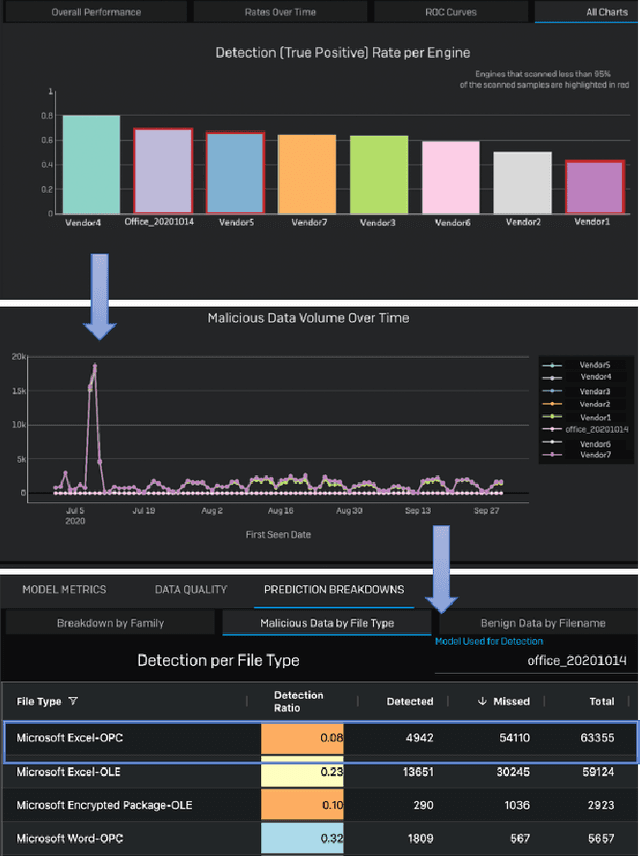
Development of new machine learning models is typically done on manually curated data sets, making them unsuitable for evaluating the models' performance during operations, where the evaluation needs to be performed automatically on incoming streams of new data. Unfortunately, pure reliance on a fully automatic pipeline for monitoring model performance makes it difficult to understand if any observed performance issues are due to model performance, pipeline issues, emerging data distribution biases, or some combination of the above. With this in mind, we developed a web-based visualization system that allows the users to quickly gather headline performance numbers while maintaining confidence that the underlying data pipeline is functioning properly. It also enables the users to immediately observe the root cause of an issue when something goes wrong. We introduce a novel way to analyze performance under data issues using a data coverage equalizer. We describe the various modifications and additional plots, filters, and drill-downs that we added on top of the standard evaluation metrics typically tracked in machine learning (ML) applications, and walk through some real world examples that proved valuable for introspecting our models.
 Add to Chrome
 Add to Firefox
 Add to Edge