A General Framework for Visualizing Embedding Spaces of Neural Survival Analysis Models Based on Angular Information
Paper and Code
May 11, 2023


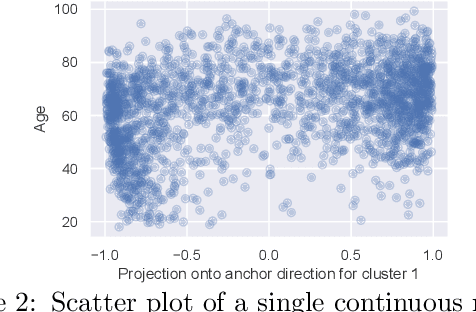
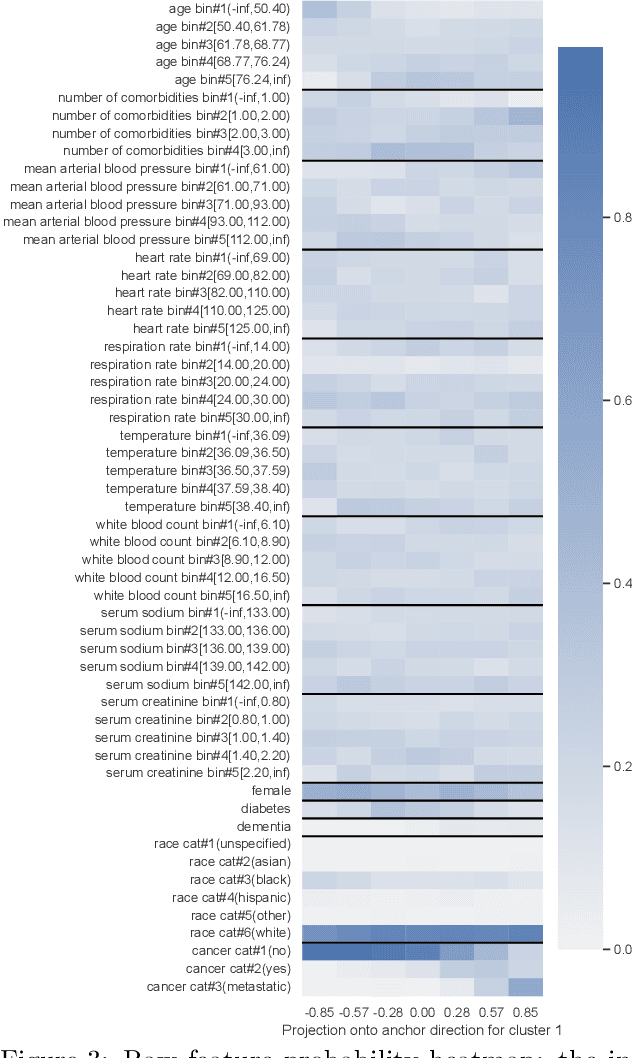
We propose a general framework for visualizing any intermediate embedding representation used by any neural survival analysis model. Our framework is based on so-called anchor directions in an embedding space. We show how to estimate these anchor directions using clustering or, alternatively, using user-supplied "concepts" defined by collections of raw inputs (e.g., feature vectors all from female patients could encode the concept "female"). For tabular data, we present visualization strategies that reveal how anchor directions relate to raw clinical features and to survival time distributions. We then show how these visualization ideas extend to handling raw inputs that are images. Our framework is built on looking at angles between vectors in an embedding space, where there could be "information loss" by ignoring magnitude information. We show how this loss results in a "clumping" artifact that appears in our visualizations, and how to reduce this information loss in practice.
 Add to Chrome
 Add to Firefox
 Add to Edge