 Add to Chrome
 Add to Firefox
 Add to Edge
ATLAS: Adaptive Topology-based Learning at Scale for Homophilic and Heterophilic Graphs
Dec 16, 2025


We present ATLAS (Adaptive Topology-based Learning at Scale for Homophilic and Heterophilic Graphs), a novel graph learning algorithm that addresses two important challenges in graph neural networks (GNNs). First, the accuracy of GNNs degrades when the graph is heterophilic. Second, iterative feature aggregation limits the scalability of GNNs to large graphs. We address these challenges by extracting topological information about graph communities at multiple levels of refinement, concatenating community assignments to the feature vector, and applying multilayer perceptrons (MLPs) to the resulting representation. This provides topological context about nodes and their neighborhoods without invoking aggregation. Because MLPs are typically more scalable than GNNs, our approach applies to large graphs without the need for sampling. Across a wide set of graphs, ATLAS achieves comparable accuracy to baseline methods, with gains as high as 20 percentage points over GCN for heterophilic graphs with negative structural bias and 11 percentage points over MLP for homophilic graphs. Furthermore, we show how multi-resolution community features systematically modulate performance in both homophilic and heterophilic settings, opening a principled path toward explainable graph learning.
From Base Data To Knowledge Discovery -- A Life Cycle Approach -- Using Multilayer Networks
May 24, 2021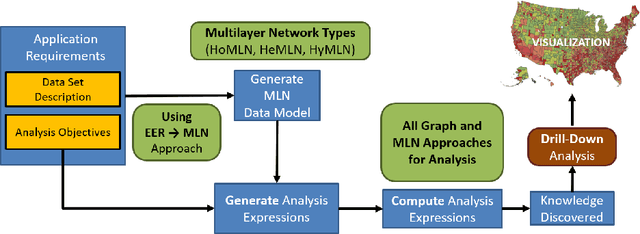
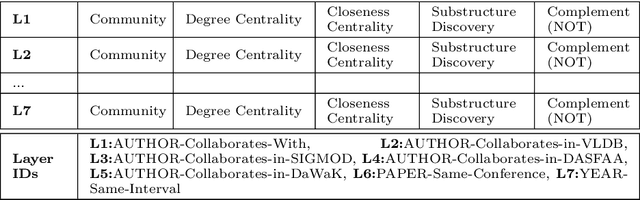
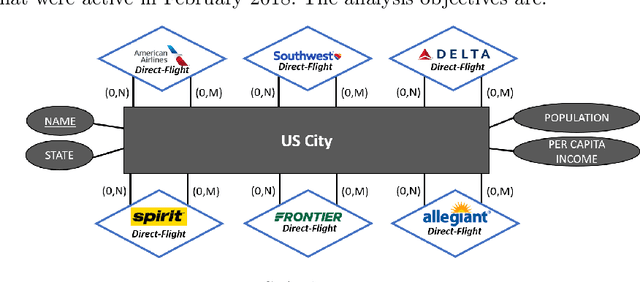

Any large complex data analysis to infer or discover meaningful information/knowledge involves the following steps (in addition to data collection, cleaning, preparing the data for analysis such as attribute elimination): i) Modeling the data -- an approach for modeling and deriving a data representation for analysis using that approach, ii) translating analysis objectives into computations on the model generated; this can be as simple as a single computation (e.g., community detection) or may involve a sequence of operations (e.g., pair-wise community detection over multiple networks) using expressions based on the model, iii) computation of the expressions generated -- efficiency and scalability come into picture here, and iv) drill-down of results to interpret or understand them clearly. Beyond this, it is also meaningful to visualize results for easier understanding. Covid-19 visualization dashboard presented in this paper is an example of this. This paper covers all of the above steps of data analysis life cycle using a data representation that is gaining importance for multi-entity, multi-feature data sets - Multilayer Networks. We use several data sets to establish the effectiveness of modeling using MLNs and analyze them using the proposed decoupling approach. For coverage, we use different types of MLNs for modeling, and community and centrality computations for analysis. The data sets used - US commercial airlines, IMDb, DBLP, and Covid-19 data set. Our experimental analyses using the identified steps validate modeling, breadth of objectives that can be computed, and overall versatility of the life cycle approach. Correctness of results is verified, where possible, using independently available ground truth. We demonstrate drill-down that is afforded by this approach (due to structure and semantics preservation) for a better understanding and visualization of results.