Jonas Van Der Donckt
Left-Right Swapping and Upper-Lower Limb Pairing for Robust Multi-Wearable Workout Activity Detection
Jul 22, 2024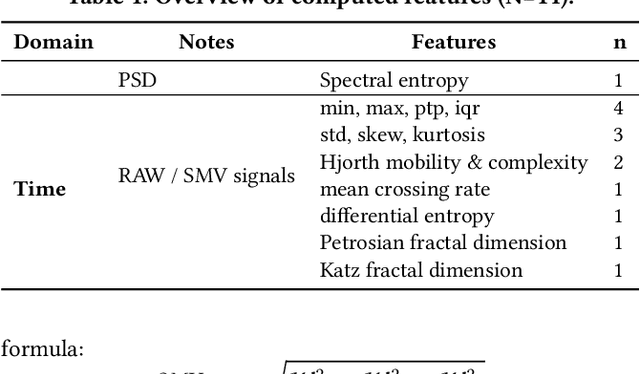
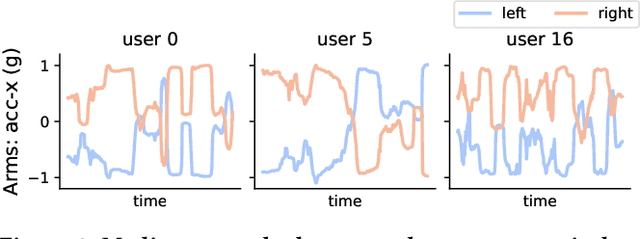
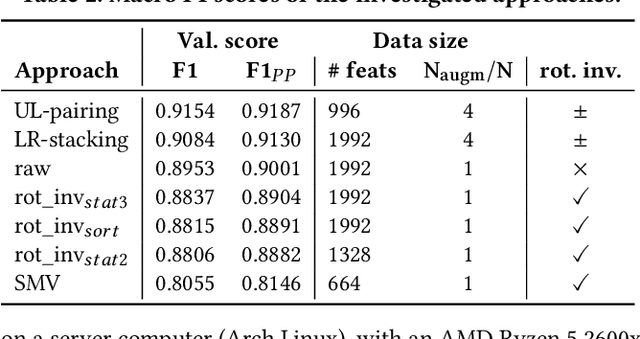

Abstract:This work presents the solution of the Signal Sleuths team for the 2024 HASCA WEAR challenge. The challenge focuses on detecting 18 workout activities (and the null class) using accelerometer data from 4 wearables - one worn on each limb. Data analysis revealed inconsistencies in wearable orientation within and across participants, leading to exploring novel multi-wearable data augmentation techniques. We investigate three models using a fixed feature set: (i) "raw": using all data as is, (ii) "left-right swapping": augmenting data by swapping left and right limb pairs, and (iii) "upper-lower limb paring": stacking data by using upper-lower limb pair combinations (2 wearables). Our experiments utilize traditional machine learning with multi-window feature extraction and temporal smoothing. Using 3-fold cross-validation, the raw model achieves a macro F1-score of 90.01%, whereas left-right swapping and upper-lower limb paring improve the scores to 91.30% and 91.87% respectively.
tsdownsample: high-performance time series downsampling for scalable visualization
Jul 05, 2023


Abstract:Interactive line chart visualizations greatly enhance the effective exploration of large time series. Although downsampling has emerged as a well-established approach to enable efficient interactive visualization of large datasets, it is not an inherent feature in most visualization tools. Furthermore, there is no library offering a convenient interface for high-performance implementations of prominent downsampling algorithms. To address these shortcomings, we present tsdownsample, an open-source Python package specifically designed for CPU-based, in-memory time series downsampling. Our library focuses on performance and convenient integration, offering optimized implementations of leading downsampling algorithms. We achieve this optimization by leveraging low-level SIMD instructions and multithreading capabilities in Rust. In particular, SIMD instructions were employed to optimize the argmin and argmax operations. This SIMD optimization, along with some algorithmic tricks, proved crucial in enhancing the performance of various downsampling algorithms. We evaluate the performance of tsdownsample and demonstrate its interoperability with an established visualization framework. Our performance benchmarks indicate that the algorithmic runtime of tsdownsample approximates the CPU's memory bandwidth. This work marks a significant advancement in bringing high-performance time series downsampling to the Python ecosystem, enabling scalable visualization. The open-source code can be found at https://github.com/predict-idlab/tsdownsample
Do Not Sleep on Linear Models: Simple and Interpretable Techniques Outperform Deep Learning for Sleep Scoring
Jul 19, 2022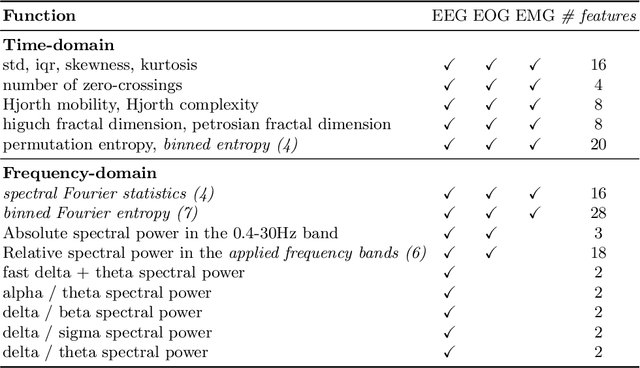
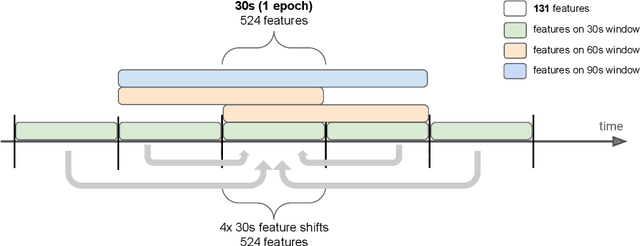

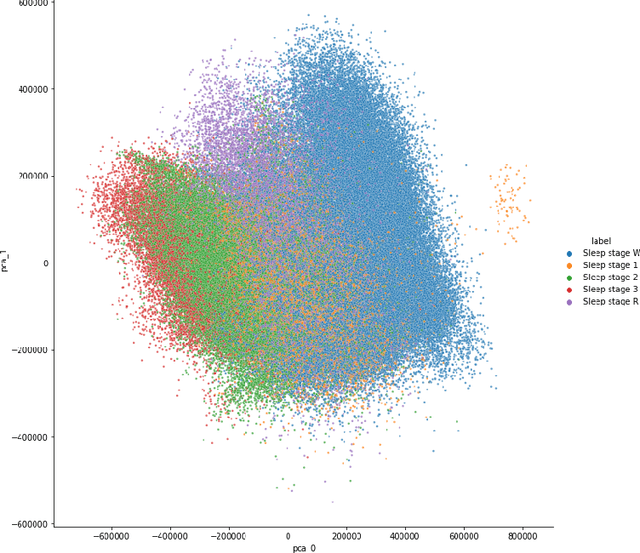
Abstract:Over the last few years, research in automatic sleep scoring has mainly focused on developing increasingly complex deep learning architectures. However, recently these approaches achieved only marginal improvements, often at the expense of requiring more data and more expensive training procedures. Despite all these efforts and their satisfactory performance, automatic sleep staging solutions are not widely adopted in a clinical context yet. We argue that most deep learning solutions for sleep scoring are limited in their real-world applicability as they are hard to train, deploy, and reproduce. Moreover, these solutions lack interpretability and transparency, which are often key to increase adoption rates. In this work, we revisit the problem of sleep stage classification using classical machine learning. Results show that state-of-the-art performance can be achieved with a conventional machine learning pipeline consisting of preprocessing, feature extraction, and a simple machine learning model. In particular, we analyze the performance of a linear model and a non-linear (gradient boosting) model. Our approach surpasses state-of-the-art (that uses the same data) on two public datasets: Sleep-EDF SC-20 (MF1 0.810) and Sleep-EDF ST (MF1 0.795), while achieving competitive results on Sleep-EDF SC-78 (MF1 0.775) and MASS SS3 (MF1 0.817). We show that, for the sleep stage scoring task, the expressiveness of an engineered feature vector is on par with the internally learned representations of deep learning models. This observation opens the door to clinical adoption, as a representative feature vector allows to leverage both the interpretability and successful track record of traditional machine learning models.
Plotly-Resampler: Effective Visual Analytics for Large Time Series
Jun 17, 2022


Abstract:Visual analytics is arguably the most important step in getting acquainted with your data. This is especially the case for time series, as this data type is hard to describe and cannot be fully understood when using for example summary statistics. To realize effective time series visualization, four requirements have to be met; a tool should be (1) interactive, (2) scalable to millions of data points, (3) integrable in conventional data science environments, and (4) highly configurable. We observe that open source Python visualization toolkits empower data scientists in most visual analytics tasks, but lack the combination of scalability and interactivity to realize effective time series visualization. As a means to facilitate these requirements, we created Plotly-Resampler, an open source Python library. Plotly-Resampler is an add-on for Plotly's Python bindings, enhancing line chart scalability on top of an interactive toolkit by aggregating the underlying data depending on the current graph view. Plotly-Resampler is built to be snappy, as the reactivity of a tool qualitatively affects how analysts visually explore and analyze data. A benchmark task highlights how our toolkit scales better than alternatives in terms of number of samples and time series. Additionally, Plotly-Resampler's flexible data aggregation functionality paves the path towards researching novel aggregation techniques. Plotly-Resampler's integrability, together with its configurability, convenience, and high scalability, allows to effectively analyze high-frequency data in your day-to-day Python environment.
tsflex: flexible time series processing & feature extraction
Nov 24, 2021


Abstract:Time series processing and feature extraction are crucial and time-intensive steps in conventional machine learning pipelines. Existing packages are limited in their real-world applicability, as they cannot cope with irregularly-sampled and asynchronous data. We therefore present $\texttt{tsflex}$, a domain-independent, flexible, and sequence first Python toolkit for processing & feature extraction, that is capable of handling irregularly-sampled sequences with unaligned measurements. This toolkit is sequence first as (1) sequence based arguments are leveraged for strided-window feature extraction, and (2) the sequence-index is maintained through all supported operations. $\texttt{tsflex}$ is flexible as it natively supports (1) multivariate time series, (2) multiple window-stride configurations, and (3) integrates with processing and feature functions from other packages, while (4) making no assumptions about the data sampling rate regularity and synchronization. Other functionalities from this package are multiprocessing, in-depth execution time logging, support for categorical & time based data, chunking sequences, and embedded serialization. $\texttt{tsflex}$ is developed to enable fast and memory-efficient time series processing & feature extraction. Results indicate that $\texttt{tsflex}$ is more flexible than similar packages while outperforming these toolkits in both runtime and memory usage.
 Add to Chrome
 Add to Firefox
 Add to Edge