Jingyi Shen
SurroFlow: A Flow-Based Surrogate Model for Parameter Space Exploration and Uncertainty Quantification
Jul 16, 2024


Abstract:Existing deep learning-based surrogate models facilitate efficient data generation, but fall short in uncertainty quantification, efficient parameter space exploration, and reverse prediction. In our work, we introduce SurroFlow, a novel normalizing flow-based surrogate model, to learn the invertible transformation between simulation parameters and simulation outputs. The model not only allows accurate predictions of simulation outcomes for a given simulation parameter but also supports uncertainty quantification in the data generation process. Additionally, it enables efficient simulation parameter recommendation and exploration. We integrate SurroFlow and a genetic algorithm as the backend of a visual interface to support effective user-guided ensemble simulation exploration and visualization. Our framework significantly reduces the computational costs while enhancing the reliability and exploration capabilities of scientific surrogate models.
PSRFlow: Probabilistic Super Resolution with Flow-Based Models for Scientific Data
Aug 08, 2023


Abstract:Although many deep-learning-based super-resolution approaches have been proposed in recent years, because no ground truth is available in the inference stage, few can quantify the errors and uncertainties of the super-resolved results. For scientific visualization applications, however, conveying uncertainties of the results to scientists is crucial to avoid generating misleading or incorrect information. In this paper, we propose PSRFlow, a novel normalizing flow-based generative model for scientific data super-resolution that incorporates uncertainty quantification into the super-resolution process. PSRFlow learns the conditional distribution of the high-resolution data based on the low-resolution counterpart. By sampling from a Gaussian latent space that captures the missing information in the high-resolution data, one can generate different plausible super-resolution outputs. The efficient sampling in the Gaussian latent space allows our model to perform uncertainty quantification for the super-resolved results. During model training, we augment the training data with samples across various scales to make the model adaptable to data of different scales, achieving flexible super-resolution for a given input. Our results demonstrate superior performance and robust uncertainty quantification compared with existing methods such as interpolation and GAN-based super-resolution networks.
IDLat: An Importance-Driven Latent Generation Method for Scientific Data
Aug 05, 2022


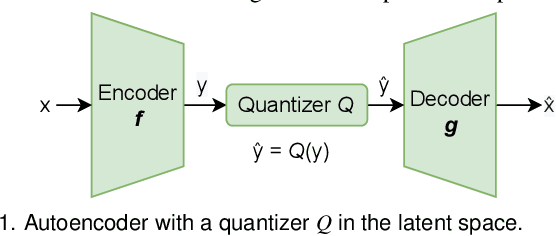
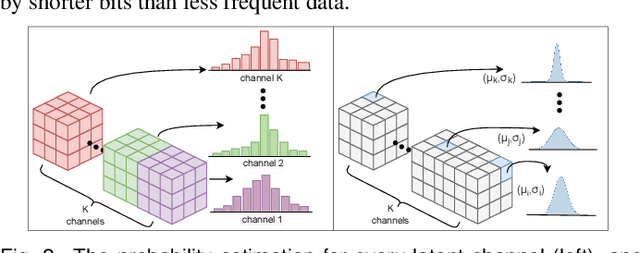
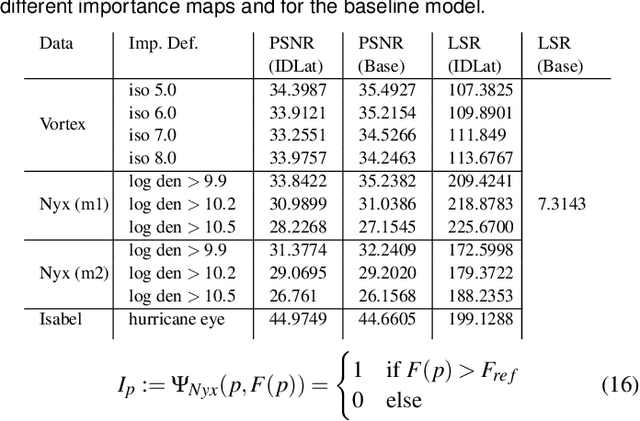
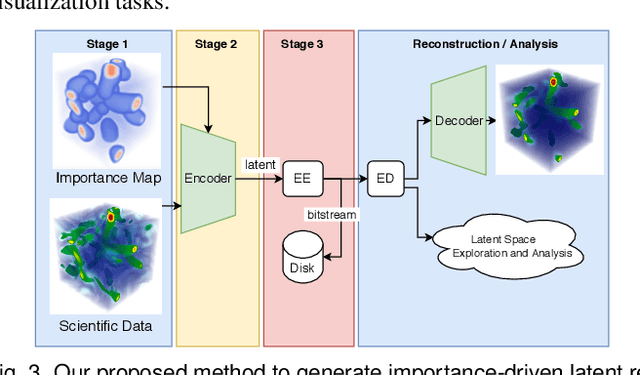
Abstract:Deep learning based latent representations have been widely used for numerous scientific visualization applications such as isosurface similarity analysis, volume rendering, flow field synthesis, and data reduction, just to name a few. However, existing latent representations are mostly generated from raw data in an unsupervised manner, which makes it difficult to incorporate domain interest to control the size of the latent representations and the quality of the reconstructed data. In this paper, we present a novel importance-driven latent representation to facilitate domain-interest-guided scientific data visualization and analysis. We utilize spatial importance maps to represent various scientific interests and take them as the input to a feature transformation network to guide latent generation. We further reduced the latent size by a lossless entropy encoding algorithm trained together with the autoencoder, improving the storage and memory efficiency. We qualitatively and quantitatively evaluate the effectiveness and efficiency of latent representations generated by our method with data from multiple scientific visualization applications.
An Information-theoretic Visual Analysis Framework for Convolutional Neural Networks
May 02, 2020


Abstract:Despite the great success of Convolutional Neural Networks (CNNs) in Computer Vision and Natural Language Processing, the working mechanism behind CNNs is still under extensive discussions and research. Driven by a strong demand for the theoretical explanation of neural networks, some researchers utilize information theory to provide insight into the black box model. However, to the best of our knowledge, employing information theory to quantitatively analyze and qualitatively visualize neural networks has not been extensively studied in the visualization community. In this paper, we combine information entropies and visualization techniques to shed light on how CNN works. Specifically, we first introduce a data model to organize the data that can be extracted from CNN models. Then we propose two ways to calculate entropy under different circumstances. To provide a fundamental understanding of the basic building blocks of CNNs (e.g., convolutional layers, pooling layers, normalization layers) from an information-theoretic perspective, we develop a visual analysis system, CNNSlicer. CNNSlicer allows users to interactively explore the amount of information changes inside the model. With case studies on the widely used benchmark datasets (MNIST and CIFAR-10), we demonstrate the effectiveness of our system in opening the blackbox of CNNs.
 Add to Chrome
 Add to Firefox
 Add to Edge