Refining time-space traffic diagrams: A multiple linear regression model
Paper and Code
Apr 09, 2022


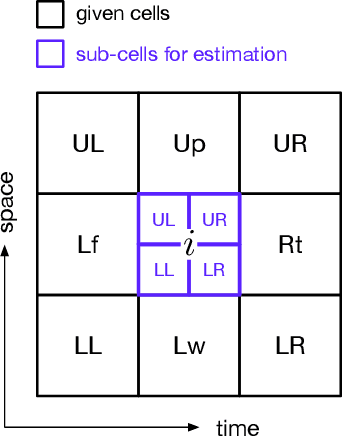
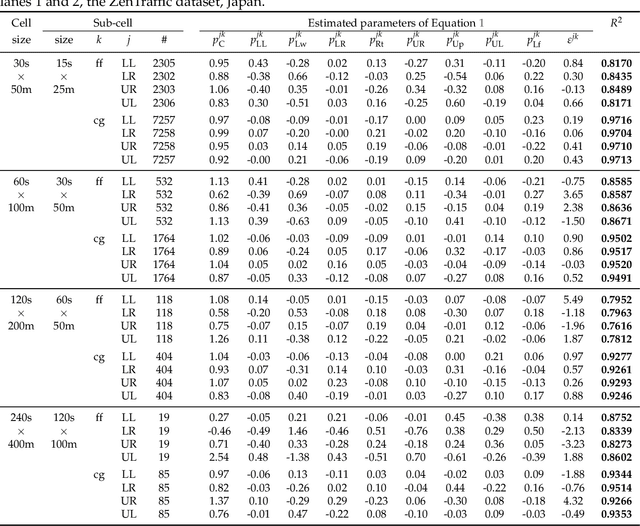
A time-space traffic (TS) diagram that presents traffic states in time-space cells with colors is one of the most important traffic analysis and visualization tools. Despite its importance for transportation research and engineering, most TS diagrams that have already existed or are being produced are too coarse to exhibit detailed traffic dynamics due to the limitation of the current information technology and traffic infrastructure investment. To increase the resolution of a TS diagram and make it present more traffic details, this paper introduces a TS diagram refinement problem and proposes a multiple linear regression-based model to solve the problem. Two tests, which attempt to increase the resolution of a TS diagram for 4 and 16 times, respectively, are carried out to evaluate the performance of the proposed model. The data collected from different time, different location and even different country is involved to thoroughly evaluate the accuracy and transferability of the proposed model. The strict tests with diverse data show that the proposed model, although it is simple in form, is able to refine a TS diagram with a promising accuracy and reliable transferability. The proposed refinement model will "save" those widely-existing TS diagrams from their blurry "faces" and make it possible to learn more traffic details from those TS diagrams.
 Add to Chrome
 Add to Firefox
 Add to Edge