Interactive Graphics for Visually Diagnosing Forest Classifiers in R
Paper and Code
Apr 08, 2017


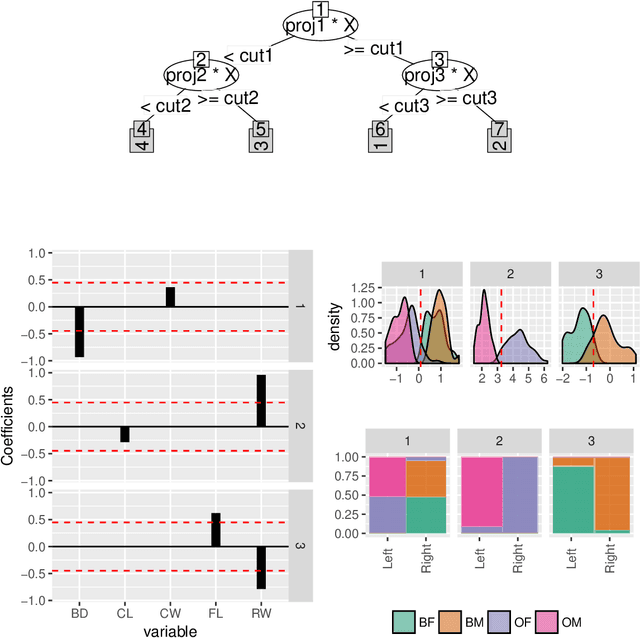
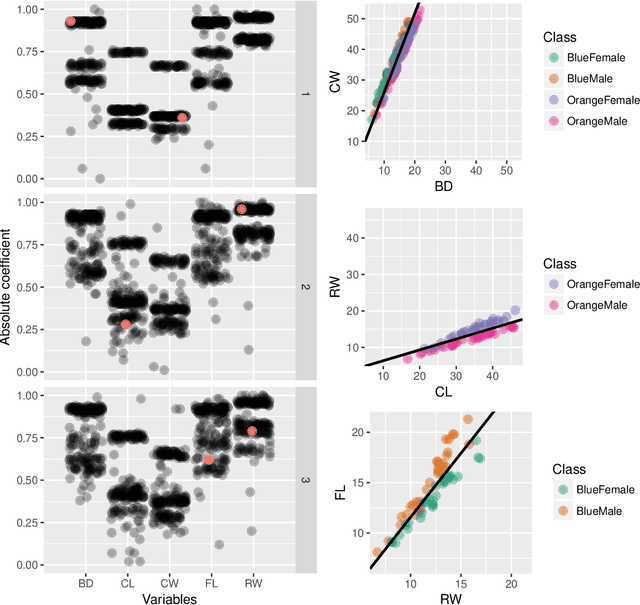
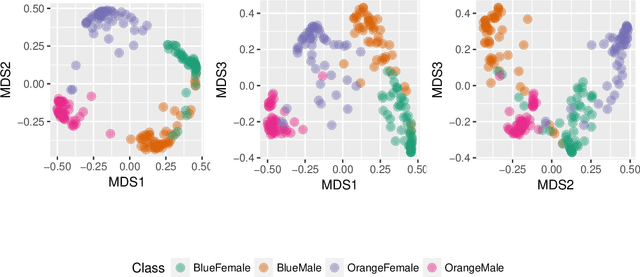
This paper describes structuring data and constructing plots to explore forest classification models interactively. A forest classifier is an example of an ensemble, produced by bagging multiple trees. The process of bagging and combining results from multiple trees, produces numerous diagnostics which, with interactive graphics, can provide a lot of insight into class structure in high dimensions. Various aspects are explored in this paper, to assess model complexity, individual model contributions, variable importance and dimension reduction, and uncertainty in prediction associated with individual observations. The ideas are applied to the random forest algorithm, and to the projection pursuit forest, but could be more broadly applied to other bagged ensembles. Interactive graphics are built in R, using the ggplot2, plotly, and shiny packages.
 Add to Chrome
 Add to Firefox
 Add to Edge